Fig. 7
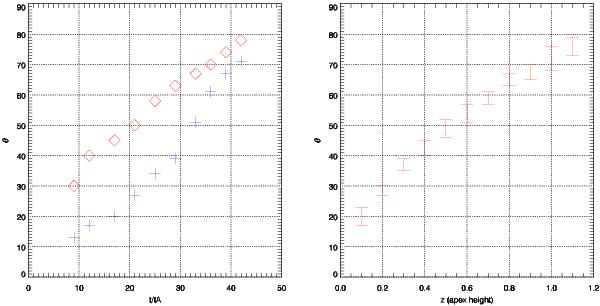
Left: time-evolution of the shear angle θ of the post-flare loops which pass above the center of the PIL at x = y = 0. The 10 blue plus signs stand for the post-flare loops that have reconnected at most 1 tA before the times at which they are drawn. Their corresponding loop apexes are z = 0.2,0.3,...,1,1.1. The red diamonds correspond to the post-flare loops passing through the same z values, which have formed at later times during the flare, while the former loops have relaxed and shrunk to lower z values. Right: dispersion of θ values of the post-flare loops along the PIL at t = 46 tA, as a function of the altitude z of their apex. In both panels, θ values are measured from the footpoints of the post-flare loops.
Current usage metrics show cumulative count of Article Views (full-text article views including HTML views, PDF and ePub downloads, according to the available data) and Abstracts Views on Vision4Press platform.
Data correspond to usage on the plateform after 2015. The current usage metrics is available 48-96 hours after online publication and is updated daily on week days.
Initial download of the metrics may take a while.