Fig. 6
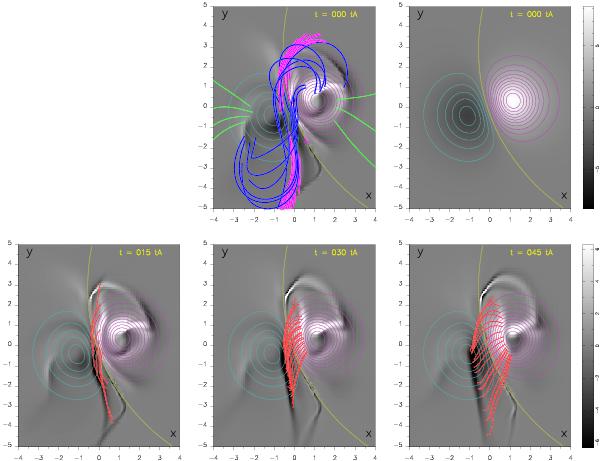
Pre-eruptive magnetic field configuration, evolving post-flare loops and moving photospheric currents, as viewed from above. Upper-right panel: cyan/pink contours and greyscale image of negative/positive magnetic fields Bz(z = 0), with the color scale on the right. The yellow line is the PIL. This magnetic field is fixed in time, so the same contours are reproduced in all panels. Upper-left panel: the pre-eruptive magnetic field configuration. The blue (resp. green) lines are typical sigmoidal and highly sheared (resp. large-scale and nearly potential) arcades. The pink lines show the dipped portions of every concave-up field lines. The greyscale image shows the negative/positive photospheric currents  . The same is plotted in the lower panels, with the color scale on their right. Lower panels: three sets of post-flare red field lines, each drawn at three different times.
Current usage metrics show cumulative count of Article Views (full-text article views including HTML views, PDF and ePub downloads, according to the available data) and Abstracts Views on Vision4Press platform.
Data correspond to usage on the plateform after 2015. The current usage metrics is available 48-96 hours after online publication and is updated daily on week days.
Initial download of the metrics may take a while.