Fig. 5
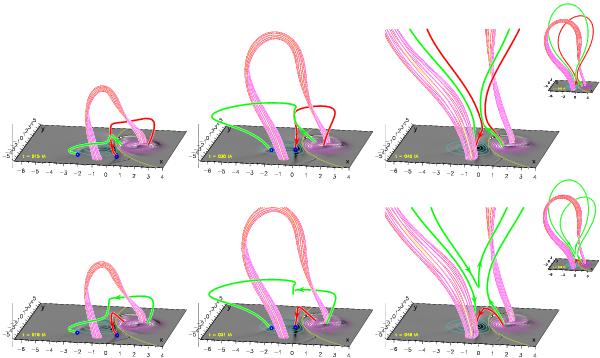
Three-dimensional plots of selected reconnecting field line pairs, chosen at three different times throughout the simulation (at t = 15,30,45 tA). In the upper (resp. lower) panels, the field lines are drawn before (resp. after) their reconnection. The small blue circles indicate the fixed footpoints at z = 0, from which each green/red field line pairs are integrated, both before and after they reconnect. The inserts on the right show the same cropped field lines as drawn in the third column, but plotted with their full lengths. The thin red/pink flux rope is the same as plotted in Fig. 3. The greyscale images (resp. the overplotted contours) show the vertical component of the electric current  (resp. magnetic field Bz(z = 0)) in the photosphere, where black/white (resp. cyan/pink) corresponds to negative/positive values, and the yellow line marks the PIL.
Current usage metrics show cumulative count of Article Views (full-text article views including HTML views, PDF and ePub downloads, according to the available data) and Abstracts Views on Vision4Press platform.
Data correspond to usage on the plateform after 2015. The current usage metrics is available 48-96 hours after online publication and is updated daily on week days.
Initial download of the metrics may take a while.