Fig. 3
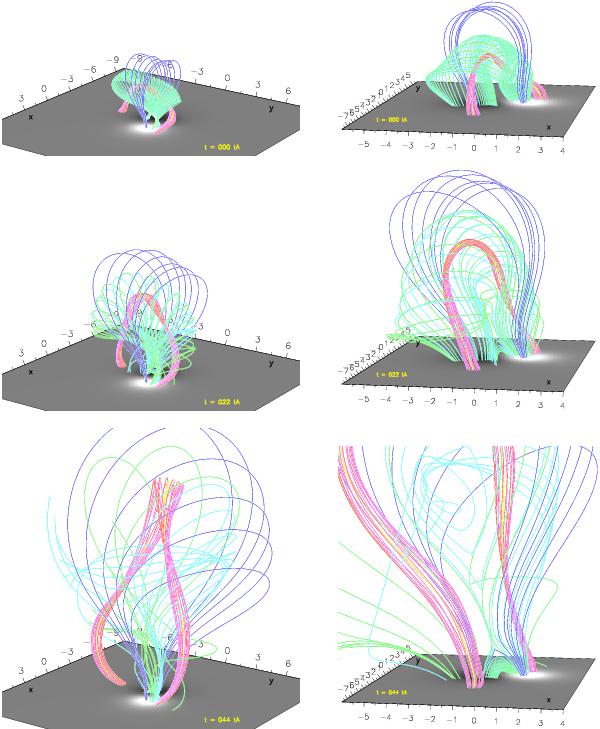
Three-dimensional plots of the time-evolution of selected magnetic field lines. The left column is a projection view which shows the CME in most of the numerical domain. The right column is a zoom on the central and lower regions, which shows the post-flare loop formation at a viewing angle along the PIL. The greyscale images show the vertical component of the photospheric magnetic field Bz(z = 0).
Current usage metrics show cumulative count of Article Views (full-text article views including HTML views, PDF and ePub downloads, according to the available data) and Abstracts Views on Vision4Press platform.
Data correspond to usage on the plateform after 2015. The current usage metrics is available 48-96 hours after online publication and is updated daily on week days.
Initial download of the metrics may take a while.