Fig. 1
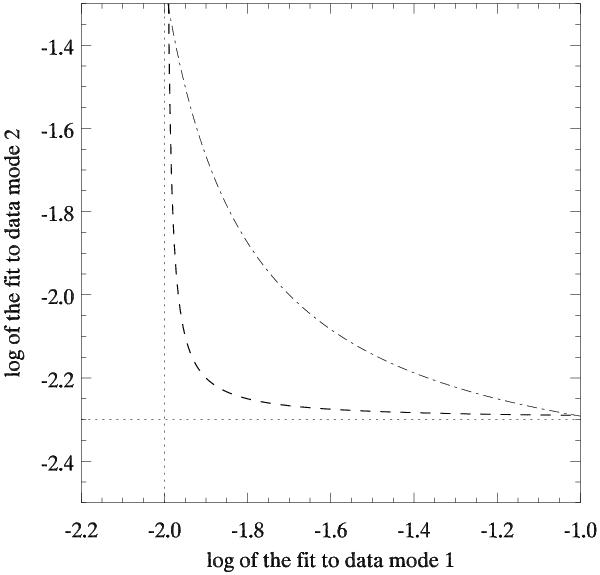
A schematic of the curve [x(λ),y(λ)] and the maximum compatibility estimate (the point closest to the new origin at the intersection of the dotted lines). The dashed line corresponds to a case with closely compatible data sources, while dot-dash indicates a case with systematic errors in models and/or data. The weight parameter λ for data mode 2 increases from left (λ = 0) to right (λ = ∞) on a curve.
Current usage metrics show cumulative count of Article Views (full-text article views including HTML views, PDF and ePub downloads, according to the available data) and Abstracts Views on Vision4Press platform.
Data correspond to usage on the plateform after 2015. The current usage metrics is available 48-96 hours after online publication and is updated daily on week days.
Initial download of the metrics may take a while.