Fig. 4
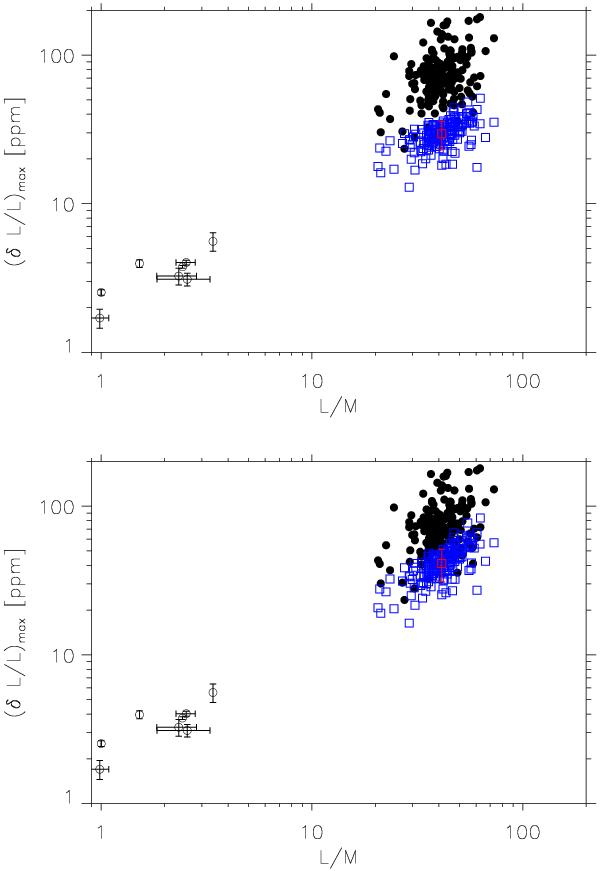
Top: maximum of the mode intensity fluctuation (δL/L)max as a function of L/M. The filled circles correspond to the seismic measurements performed by Baudin et al. (2011) on a large number of CoRoT red giant stars (~170 targets). We only considered the targets for which the mode line width is broader than twice the frequency resolution (see Sect. 3.1). The empty circles correspond to the MS stars observed so far by CoRoT (see Baudin et al. 2011), and the blue squares are the theoretical (δL/L)max computed according to the Kjeldsen & Bedding (1995) adiabatic coefficient (Eq. (16), see Sect. 3.3.1). The red square corresponds to the median value of the theoretical  and the associated vertical bar corresponds to the bias introduced by the 1-σ error associated with the parameters p ∗ , s,
  , and ℳ0, ∗ ,
  and
and  (see Eq. (15)). Bottom: same as top, the theoretical (δL/L)max are computed here assuming for ζ the non-adiabatic scaling relation established in Sect. 2.4.2 (see also Fig. 2). The red error bar here also accounts for the 1-σ error associated with the parameters k and ζ0 (see Eq. (17) and Sect. 2.4.2).
Current usage metrics show cumulative count of Article Views (full-text article views including HTML views, PDF and ePub downloads, according to the available data) and Abstracts Views on Vision4Press platform.
Data correspond to usage on the plateform after 2015. The current usage metrics is available 48-96 hours after online publication and is updated daily on week days.
Initial download of the metrics may take a while.