Fig. 1
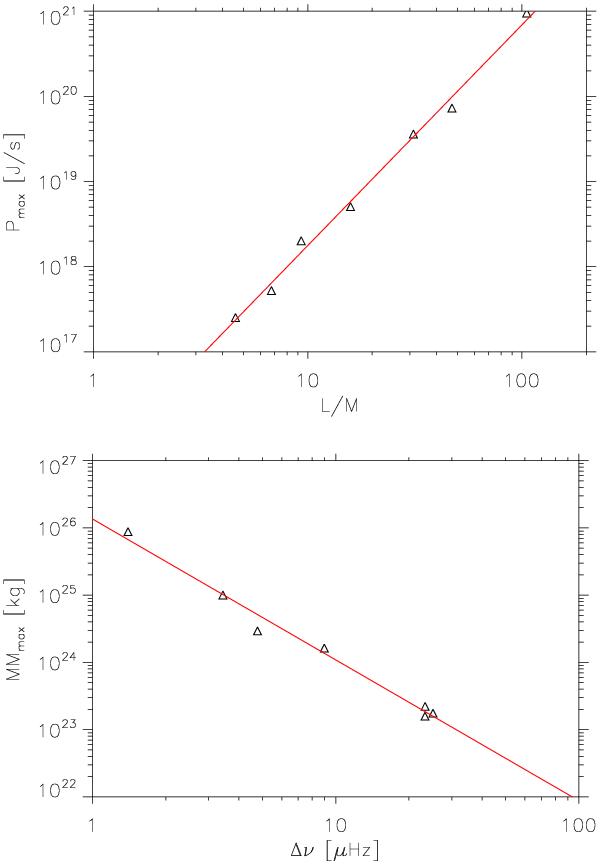
Top:  as a function of L/M. The triangles are associated with the 3D models. The red line is a power law of the form (L/M)s with s = 2.6. Bottom: mode mass at ν = νmax (ℳmax) as a function of the large separation Δν. The mode masses are evaluated here at the layer corresponding to the optical depth τ 500 nm = 0.013 (see text). The triangles are associated with the 3D models. The red line is a power law of the form (Δν/Δν⊙) − p with p = 2.1.
Current usage metrics show cumulative count of Article Views (full-text article views including HTML views, PDF and ePub downloads, according to the available data) and Abstracts Views on Vision4Press platform.
Data correspond to usage on the plateform after 2015. The current usage metrics is available 48-96 hours after online publication and is updated daily on week days.
Initial download of the metrics may take a while.