Open Access
Fig. 8
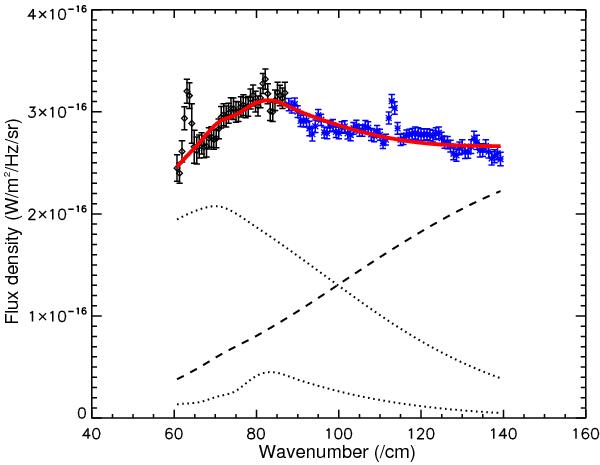
Same as Fig. 2c, but the spectrum is fitted by the warm and cold dust model including the second cold component with the large graphite population (see text for details). The two cold components and the warm component are indicated by the dotted lines and the dashed line, respectively.
Current usage metrics show cumulative count of Article Views (full-text article views including HTML views, PDF and ePub downloads, according to the available data) and Abstracts Views on Vision4Press platform.
Data correspond to usage on the plateform after 2015. The current usage metrics is available 48-96 hours after online publication and is updated daily on week days.
Initial download of the metrics may take a while.