Fig. 7
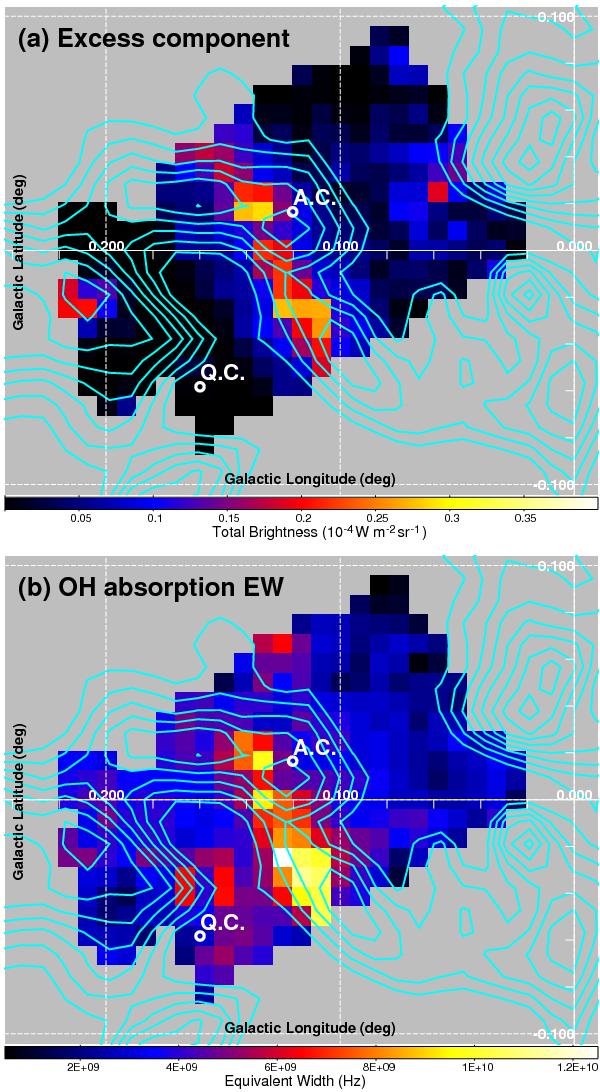
a) Distribution of the total brightness of the excess component on the contour map of the 12CO(J = 1–0) integrated over the velocity range of + 70 to + 90 km s-1. The contours are linearly drawn from 100 to 280 K km s-1. b) Distribution of the equivalent width of the OH 119 μm absorption line, which is derived by dividing the line flux by the continuum intensity at the central wavenumber. The contour map is the same as that in panel a).
Current usage metrics show cumulative count of Article Views (full-text article views including HTML views, PDF and ePub downloads, according to the available data) and Abstracts Views on Vision4Press platform.
Data correspond to usage on the plateform after 2015. The current usage metrics is available 48-96 hours after online publication and is updated daily on week days.
Initial download of the metrics may take a while.