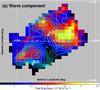
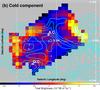
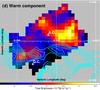
Fig. 6
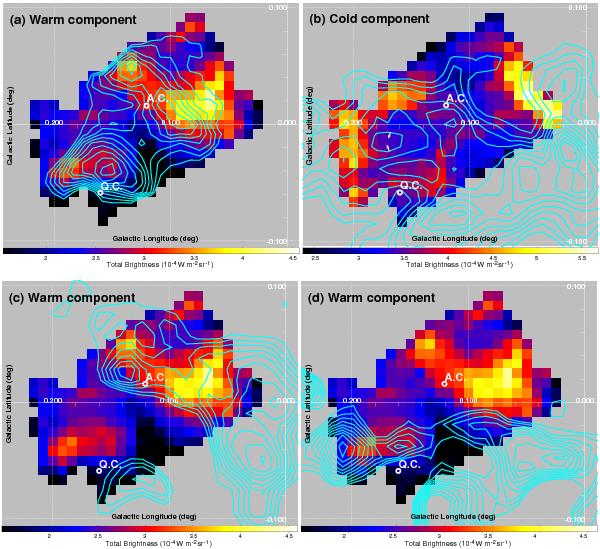
a) Distribution of the total brightness of the warm dust component with the contour map of the [OIII] line emission from the same data as in Fig. 4b. The contour levels are linearly drawn from 1 × 10⁻⁶ to 3 × 10⁻⁶ W m-2 sr-1. b) Distribution of the total brightness of the cold dust component with the contour map of the 12CO J = 1–0 emission integrated over the total velocity range (VLSR = −220 to + 220 km s-1; Oka et al. 1998). The contours are linearly drawn from 690 to 1200 K km s-1. c) The contour maps of the 12CO J = 1–0 emission integrated over the velocity range of − 30 to − 10 km s-1 and d) that over + 20 to + 40 km s-1, both superimposed on the same distribution map of the warm dust component as shown in panel a). The contours are linearly drawn from 50 to 130 K km s-1 for panel c) and from 160 to 240 K km s-1 for panel d).
Current usage metrics show cumulative count of Article Views (full-text article views including HTML views, PDF and ePub downloads, according to the available data) and Abstracts Views on Vision4Press platform.
Data correspond to usage on the plateform after 2015. The current usage metrics is available 48-96 hours after online publication and is updated daily on week days.
Initial download of the metrics may take a while.