Fig. 4
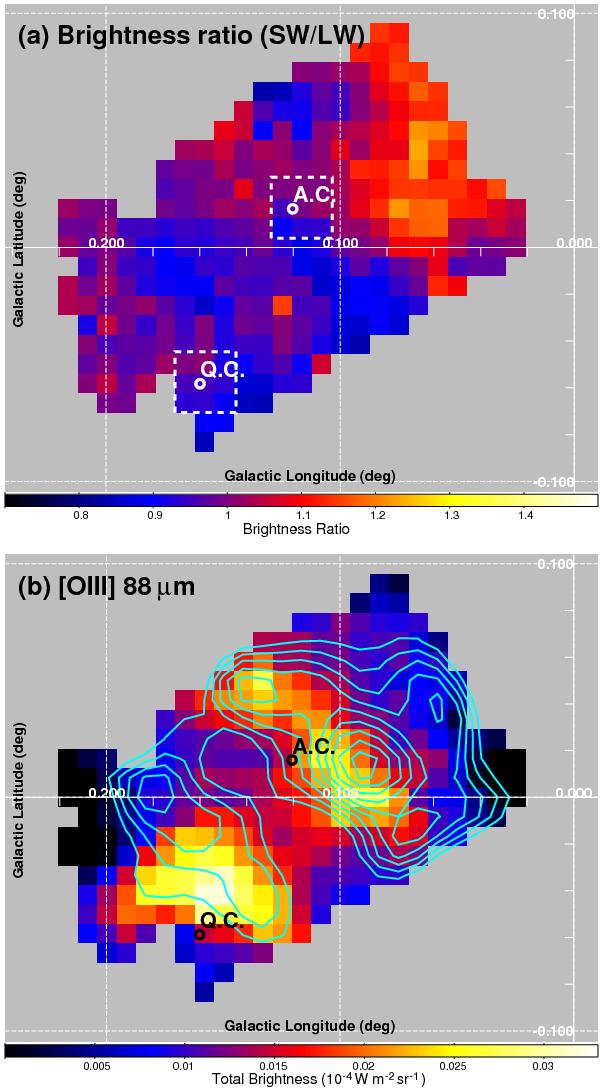
a) Brightness ratio map derived from the SW continuum averaged over the range of 88–131 cm-1 that is divided by the LW continuum over 66–87 cm-1. The dashed squares indicate the aperture regions used to obtain the spectra shown in Figs. 2c and d. b) [OIII] 88 μm line intensity map overlaid on the contours of the [NII] 122 μm line intensity. The contour levels are linearly scaled from 4 × 10⁻⁷ to 1.5 × 10⁻⁶ W m-2 sr-1.
Current usage metrics show cumulative count of Article Views (full-text article views including HTML views, PDF and ePub downloads, according to the available data) and Abstracts Views on Vision4Press platform.
Data correspond to usage on the plateform after 2015. The current usage metrics is available 48-96 hours after online publication and is updated daily on week days.
Initial download of the metrics may take a while.