Open Access
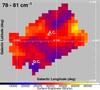
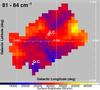
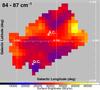
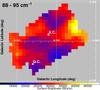
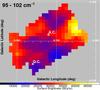
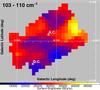
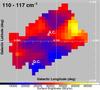
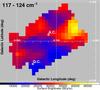
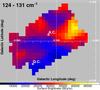
Fig. 3
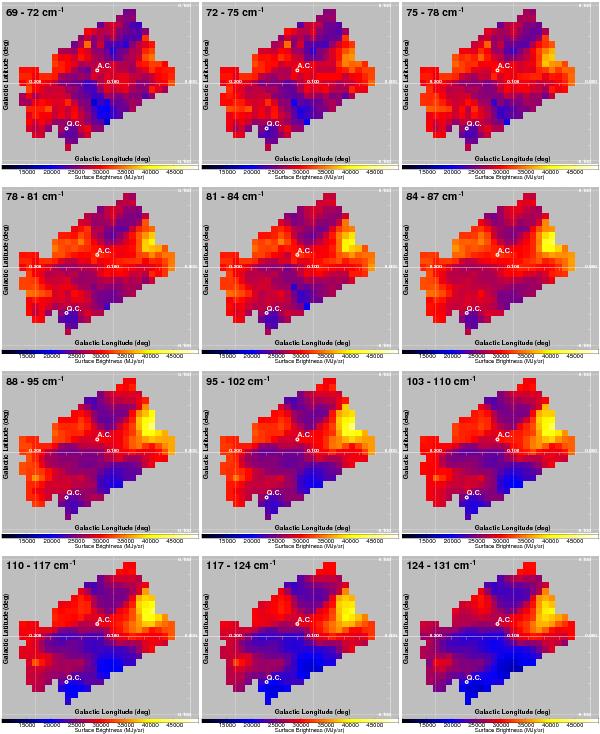
Far-IR continuum maps obtained by the LW (upper six) and SW (lower six maps) arrays of AKARI FIS-FTS for the denoted integration ranges of wavenumbers. The surface brightness levels are given on common color scales among the maps.
This figure is made of several images, please see below:
Current usage metrics show cumulative count of Article Views (full-text article views including HTML views, PDF and ePub downloads, according to the available data) and Abstracts Views on Vision4Press platform.
Data correspond to usage on the plateform after 2015. The current usage metrics is available 48-96 hours after online publication and is updated daily on week days.
Initial download of the metrics may take a while.