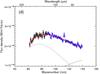
Fig. 2
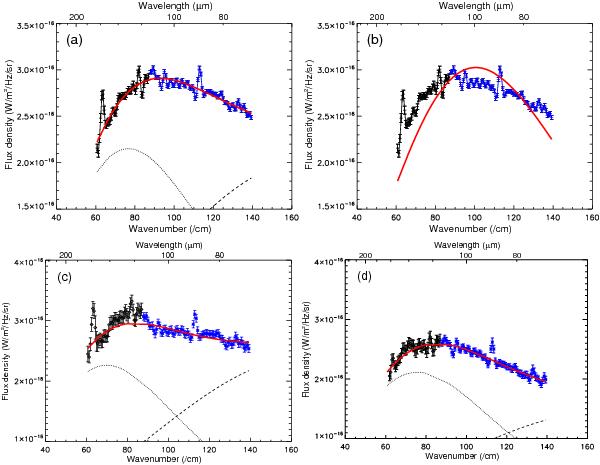
AKARI/FIS-FTS spectra of a), b) the total region covered by both SW and LW, c) the regions toward the Arches cluster, and d) the Quintuplet cluster. The results of the double-temperature (panels a), c), d)) and single-temperature (panel b)) modified blackbody model fitting are shown together, where the wavenumber ranges corresponding to the emission lines ([OIII]: 111 to 115 cm-1, [NII]: 81 to 85 cm-1, [CII]: 62 to 66 cm-1) and the excess feature (80 to 90 cm-1) are masked in the spectral fitting. Here and hereafter, the different colors are used to show the spectra derived from the SW (blue) and LW (black) detectors. The aperture regions used to extract spectra (c) and (d) are indicated in Fig. 4a.
Current usage metrics show cumulative count of Article Views (full-text article views including HTML views, PDF and ePub downloads, according to the available data) and Abstracts Views on Vision4Press platform.
Data correspond to usage on the plateform after 2015. The current usage metrics is available 48-96 hours after online publication and is updated daily on week days.
Initial download of the metrics may take a while.