Free Access
Fig. 7
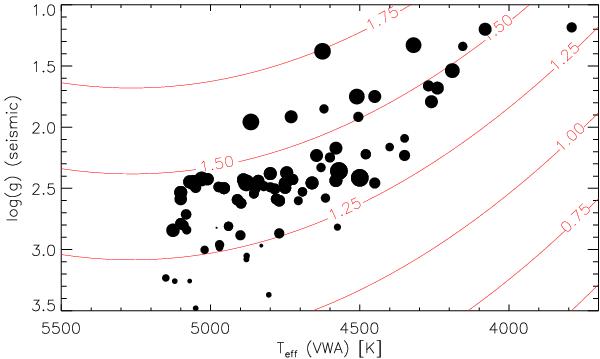
Diagram of 81 giants with asteroseismic log g in the (log g, Teff)-plane. Overplotted are contours of constant microturbulence (Eq. (4)). The size of the symbols is proportional to the microturbulence as determined from the spectroscopic analysis. The microturbulence is in the range [0.9, 2.25] km s-1.
Current usage metrics show cumulative count of Article Views (full-text article views including HTML views, PDF and ePub downloads, according to the available data) and Abstracts Views on Vision4Press platform.
Data correspond to usage on the plateform after 2015. The current usage metrics is available 48-96 hours after online publication and is updated daily on week days.
Initial download of the metrics may take a while.