Fig. 6
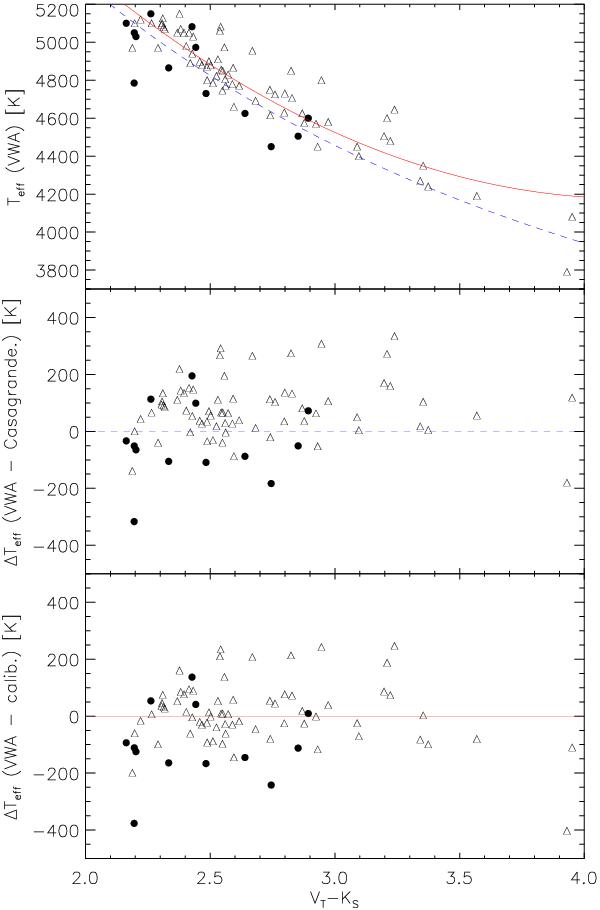
The upper panel shows the spectroscopic Teff vs. (VT − KS) for the giants in our sample. The filled circles show targets for which we were able to measure the reddening, whereas the open triangles have not been corrected for reddening. The solid red line shows the calibration from in Bruntt et al. (2012) based on 93 main sequence and sub-giant stars. The dashed blue line shows the calibration from Casagrande et al. (2010). The two lower panels show the residuals.
Current usage metrics show cumulative count of Article Views (full-text article views including HTML views, PDF and ePub downloads, according to the available data) and Abstracts Views on Vision4Press platform.
Data correspond to usage on the plateform after 2015. The current usage metrics is available 48-96 hours after online publication and is updated daily on week days.
Initial download of the metrics may take a while.