Fig. 3
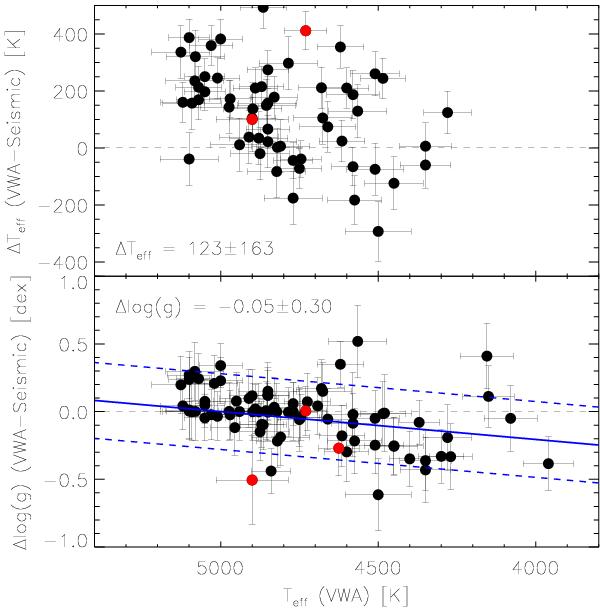
Comparison between parameters determined by VWA and from the asteroseismic analysis. The Pop. II stars in our sample are marked with red circles. The mean deviations and RMS-scatter are shown in the figure. The blue line indicate a linear fit to the deviation in log g with the dashed lines indicating the RMS-scatter of the fit. For clarity, one strong outlier in Δlog g is not shown in the plot.
Current usage metrics show cumulative count of Article Views (full-text article views including HTML views, PDF and ePub downloads, according to the available data) and Abstracts Views on Vision4Press platform.
Data correspond to usage on the plateform after 2015. The current usage metrics is available 48-96 hours after online publication and is updated daily on week days.
Initial download of the metrics may take a while.