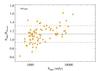
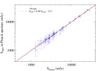
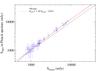
Fig. 8
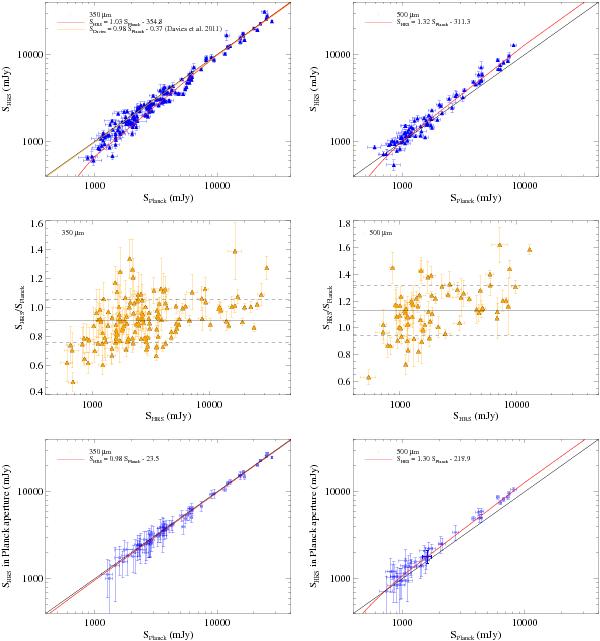
Upper panels: the HRS versus Planck flux densities of 144 bright galaxies at 350 μm and 76 bright galaxies at 500 μm. The black lines are the one to one relationship in log scale. The red lines are the results of the linear fit; the orange line, on the 350 μm plot, is the result of Davies et al. (2012) linear least squares fit. Middle panels: the HRS/Planck flux density ratio versus the HRS flux densities at 350 μm and 500 μm. The black line corresponds to the mean ratio, the dashed lines correspond to the standard deviation of the ratios. Lower panels: Planck flux densities versus HRS flux densities measured in the aperture used by the Planck Consortium at 350 μm and 500 μm.
Current usage metrics show cumulative count of Article Views (full-text article views including HTML views, PDF and ePub downloads, according to the available data) and Abstracts Views on Vision4Press platform.
Data correspond to usage on the plateform after 2015. The current usage metrics is available 48-96 hours after online publication and is updated daily on week days.
Initial download of the metrics may take a while.