Fig. 6
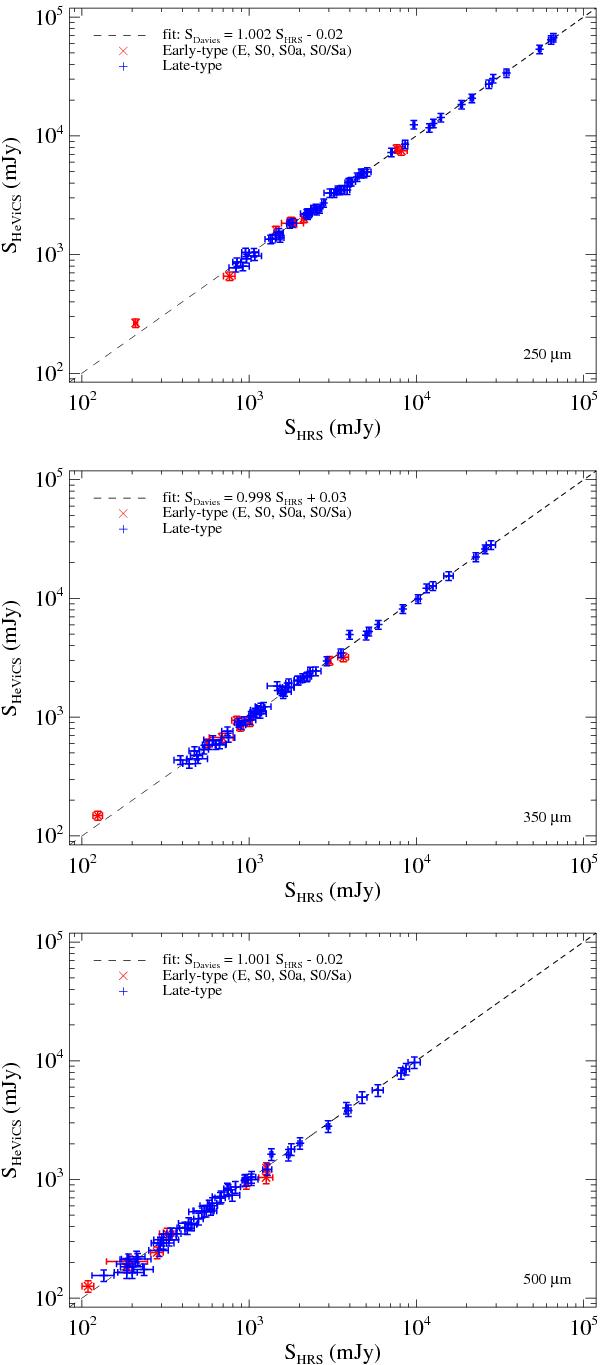
A comparison of the flux densities of the 59 sources common to both the HRS sample and the HeViCS Virgo bright galaxy sample (Davies et al. 2012) at 250, 350 and 500 μm. Red triangles are for early type galaxies, blue triangles for late type galaxies. The dashed line indicates the linear fit.
This figure is made of several images, please see below:
Current usage metrics show cumulative count of Article Views (full-text article views including HTML views, PDF and ePub downloads, according to the available data) and Abstracts Views on Vision4Press platform.
Data correspond to usage on the plateform after 2015. The current usage metrics is available 48-96 hours after online publication and is updated daily on week days.
Initial download of the metrics may take a while.