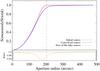
Fig. 2
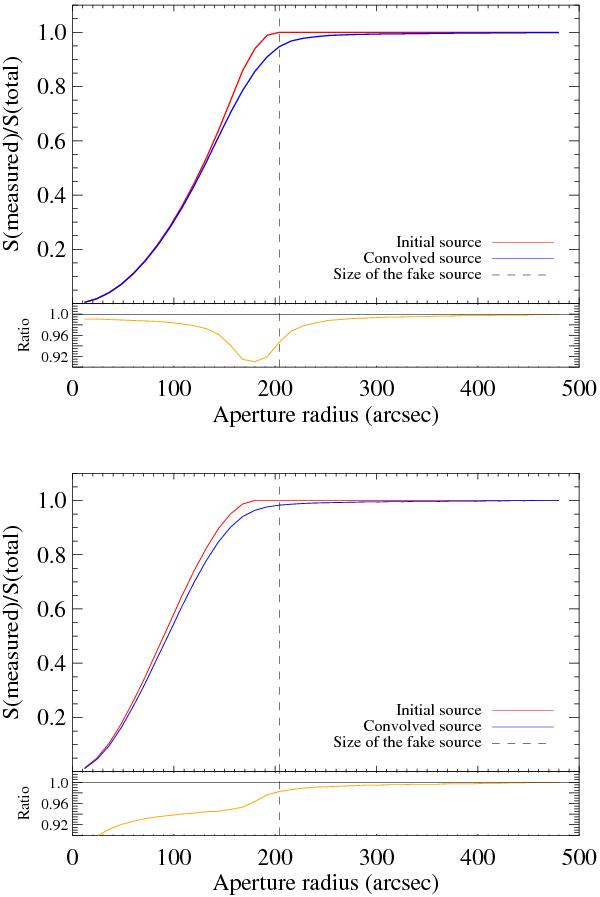
Simulation of the photometry of an extended face-on spiral galaxy at 500 μm. Upper panel: a flat extended source. In red, the integrated radial profile of the original source, and in blue of the convolved source. In orange, the convolved to original source flux density ratios. The dashed line marks the size of the original source. Lower panel: an extended galaxy with a linear surface brightness profile.
Current usage metrics show cumulative count of Article Views (full-text article views including HTML views, PDF and ePub downloads, according to the available data) and Abstracts Views on Vision4Press platform.
Data correspond to usage on the plateform after 2015. The current usage metrics is available 48-96 hours after online publication and is updated daily on week days.
Initial download of the metrics may take a while.