Fig. 1
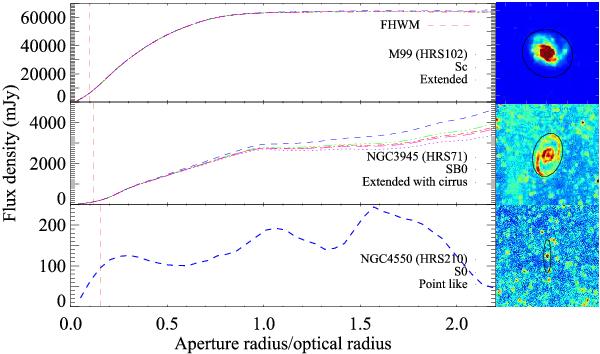
Growth curves at 250 μm of the galaxies M 99 (HRS 102), NGC 3945 (HRS 71), and NGC 4550 (HRS 210). The different colored curves are obtained by changing the background estimate region as described in the text. The vertical red dashed lines correspond to the FWHM of the SPIRE beam at 250 μm. The right panels show the 250 μm images of the three galaxies, the black ellipses indicate the optical shapes of the galaxies.
Current usage metrics show cumulative count of Article Views (full-text article views including HTML views, PDF and ePub downloads, according to the available data) and Abstracts Views on Vision4Press platform.
Data correspond to usage on the plateform after 2015. The current usage metrics is available 48-96 hours after online publication and is updated daily on week days.
Initial download of the metrics may take a while.