Fig. 4
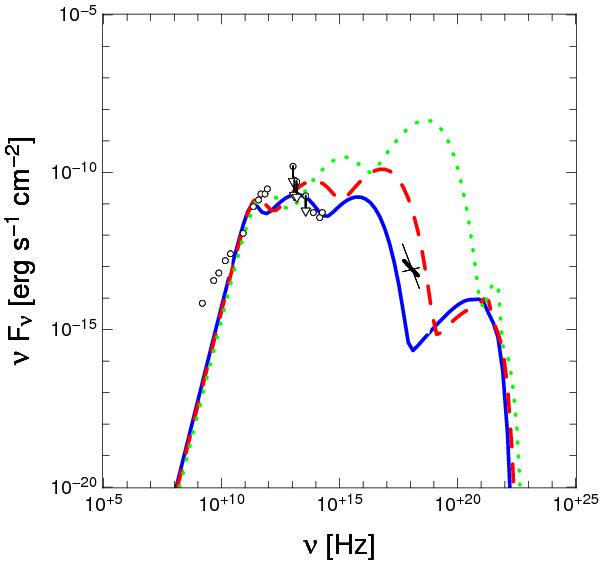
Impact of spin on an ion torus spectrum: a = 0 (solid blue), 0.5M (dashed red), or 0.9M (dotted green). All other parameters are set to their reference values listed in Table 1. The black observed data are taken from Zhao et al. (2001), Zylka et al. (1995), Marrone et al. (2008) for radio and sub-mm data, Telesco et al. (1996), Cotera et al. (1999), Eckart et al. (2006), Schödel et al. (2007) for far- and mid-infrared data, Genzel et al. (2003) for near-infrared data, and Baganoff et al. (2003) for the X-ray bow tie. The downward pointing arrows refer to upper values. Note that we do not present the fitted spectra here.
Current usage metrics show cumulative count of Article Views (full-text article views including HTML views, PDF and ePub downloads, according to the available data) and Abstracts Views on Vision4Press platform.
Data correspond to usage on the plateform after 2015. The current usage metrics is available 48-96 hours after online publication and is updated daily on week days.
Initial download of the metrics may take a while.