Fig. 9
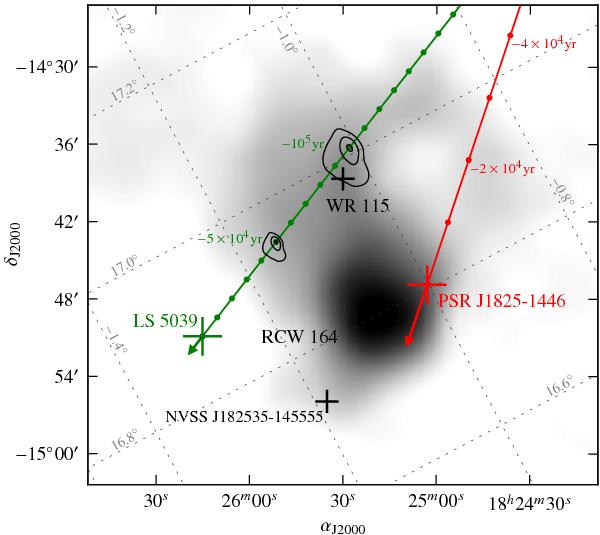
Wide-field map around SNR G016.8−01.1. The grey scale corresponds to the Parkes-MIT-NRAO survey at 5 GHz (Tasker et al. 1994). The green and red lines mark the past trajectory of LS 5039 and PSR J1825−1446, respectively. The arrows mark the proper motion sense. Circles are plotted in the trajectories every 104 yr. The contours represent the 68.2, 95.4 and 99.7% confidence levels on the position that LS 5039 had 105 and 5 × 10⁴ years ago (see uncertainties in the proper motion shown in Fig. 5). The grey dotted lines show the Galactic coordinates.
Current usage metrics show cumulative count of Article Views (full-text article views including HTML views, PDF and ePub downloads, according to the available data) and Abstracts Views on Vision4Press platform.
Data correspond to usage on the plateform after 2015. The current usage metrics is available 48-96 hours after online publication and is updated daily on week days.
Initial download of the metrics may take a while.