Free Access
Fig. 5
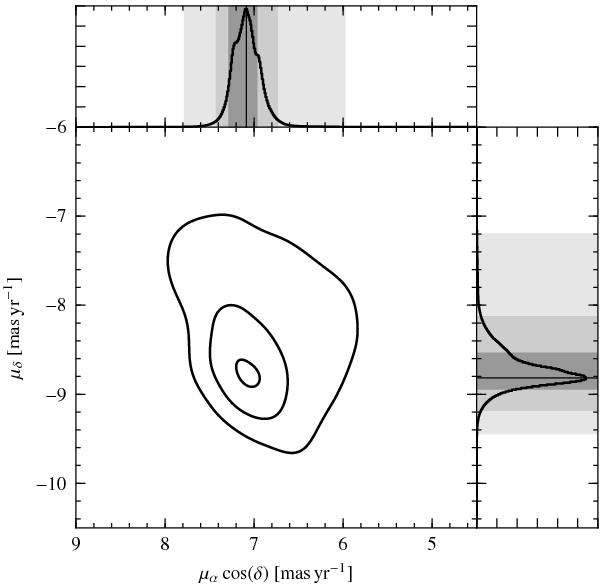
Distribution of proper motion fits for LS 5039 computed with the bootstrap method. The central contours represent, from inside to outside, the minimum smoothed regions containing 68.2, 95.4, and 99.7% of the events. The two histograms are the projected 1D distributions shown in Fig. 4.
Current usage metrics show cumulative count of Article Views (full-text article views including HTML views, PDF and ePub downloads, according to the available data) and Abstracts Views on Vision4Press platform.
Data correspond to usage on the plateform after 2015. The current usage metrics is available 48-96 hours after online publication and is updated daily on week days.
Initial download of the metrics may take a while.