Fig. 3
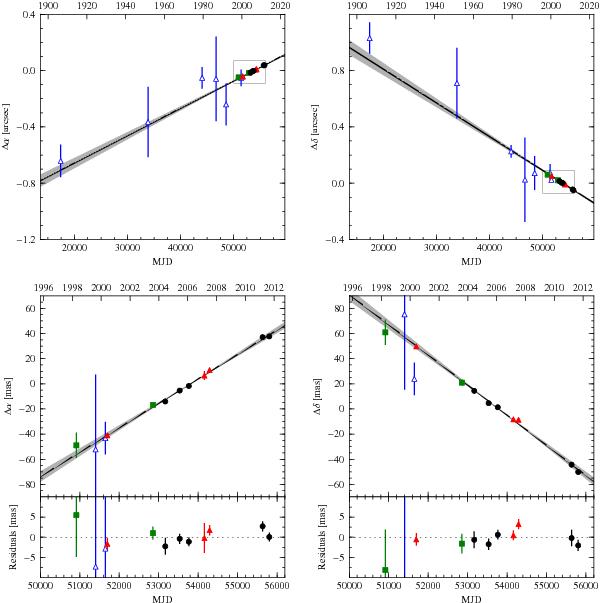
Offsets in right ascension (left) and declination (right) of LS 5039 with respect to time in MJD and year. The solid black lines in each panel represent the fitted proper motion, and the grey area the uncertainty of the fit at 3-σ level. The upper panels include all data points used for the fit, and the lower panels are the zoom of the last 16 years (marked by the small rectangles), and include the residuals with respect to the fitted model. The empty blue triangles represent the optical data, the green squares show the VLA data, the red triangles correspond to the VLBI observations at 5 GHz, and the black circles are the VLBI data at 8.6 GHz. The source positions are plotted with uncertainties at 1-σ level.
Current usage metrics show cumulative count of Article Views (full-text article views including HTML views, PDF and ePub downloads, according to the available data) and Abstracts Views on Vision4Press platform.
Data correspond to usage on the plateform after 2015. The current usage metrics is available 48-96 hours after online publication and is updated daily on week days.
Initial download of the metrics may take a while.