Fig. 2
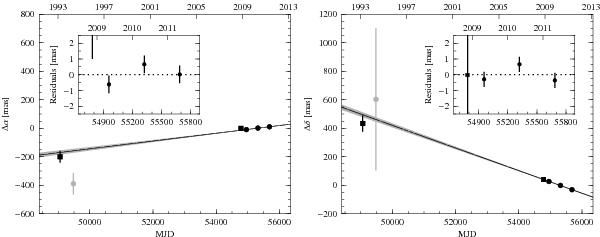
Position of PSR J1825 − 1446 with respect to time (MJD in lower axis and year in top axis) in right ascension (left) and declination (right). The solid black lines represent the fitted proper motion, and the grey area the uncertainty of the fit at 3-σ level. The black squares represent the VLA positions, the black circles indicate the VLBA positions, and the grey circle the position from pulsar timing (not used in the fit). The inset shows the position residuals from the fitted model for the 2008–2012 period. The source positions are plotted with uncertainties at 1-σ level.
Current usage metrics show cumulative count of Article Views (full-text article views including HTML views, PDF and ePub downloads, according to the available data) and Abstracts Views on Vision4Press platform.
Data correspond to usage on the plateform after 2015. The current usage metrics is available 48-96 hours after online publication and is updated daily on week days.
Initial download of the metrics may take a while.