Fig. 1
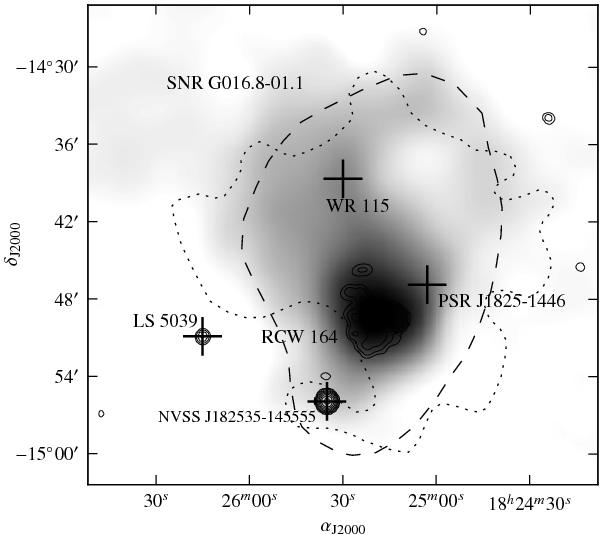
Wide field map around SNR G016.8−01.1. The grey scale corresponds to the Parkes-MIT-NRAO survey at 5 GHz (Tasker et al. 1994), and the contours, with higher resolution, to the NRAO VLA Sky Survey (NVSS) at 1.4 GHz (Condon et al. 1998). The dashed line outlines the area covered by the diffuse emission at 4.75 GHz in Reich et al. (1986), and the dotted line the polarised emission in the same image. These two components trace the morphology of SNR G016.8 − 01.1. The more relevant sources in the field are indicated.
Current usage metrics show cumulative count of Article Views (full-text article views including HTML views, PDF and ePub downloads, according to the available data) and Abstracts Views on Vision4Press platform.
Data correspond to usage on the plateform after 2015. The current usage metrics is available 48-96 hours after online publication and is updated daily on week days.
Initial download of the metrics may take a while.