Free Access
Fig. 14
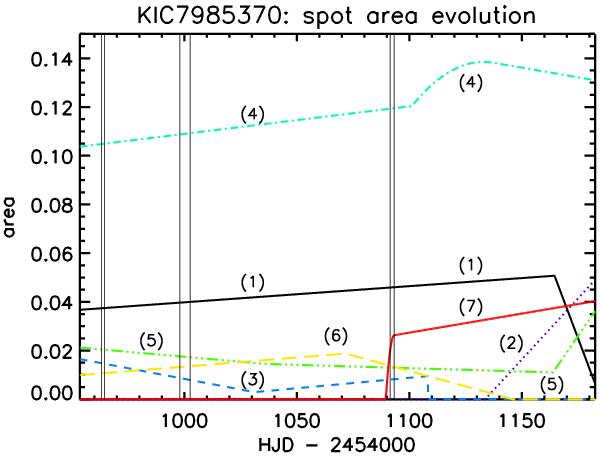
Spot area evolution (case A). Area is in units of the star’s cross-section. Vertical lines mark the boundaries of the Q0 to Q3 quarters of data. A number in parenthesis indicates the spot number.
Current usage metrics show cumulative count of Article Views (full-text article views including HTML views, PDF and ePub downloads, according to the available data) and Abstracts Views on Vision4Press platform.
Data correspond to usage on the plateform after 2015. The current usage metrics is available 48-96 hours after online publication and is updated daily on week days.
Initial download of the metrics may take a while.