Free Access
Fig. 3

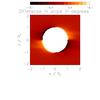
Dα for the isotropic case (upper left graph), the anisotropic cases with w⊥ = 2w, and w∥ = w (upper right graph), and w∥ = 2w, and w⊥ = w (lower left graph), respectively. The lower right graph is the de-or hyperpolarisation for the anisotropic case with w⊥ = 2w, and w∥ = w. All graphs are for the Lα line.
This figure is made of several images, please see below:


Current usage metrics show cumulative count of Article Views (full-text article views including HTML views, PDF and ePub downloads, according to the available data) and Abstracts Views on Vision4Press platform.
Data correspond to usage on the plateform after 2015. The current usage metrics is available 48-96 hours after online publication and is updated daily on week days.
Initial download of the metrics may take a while.