Fig. 7
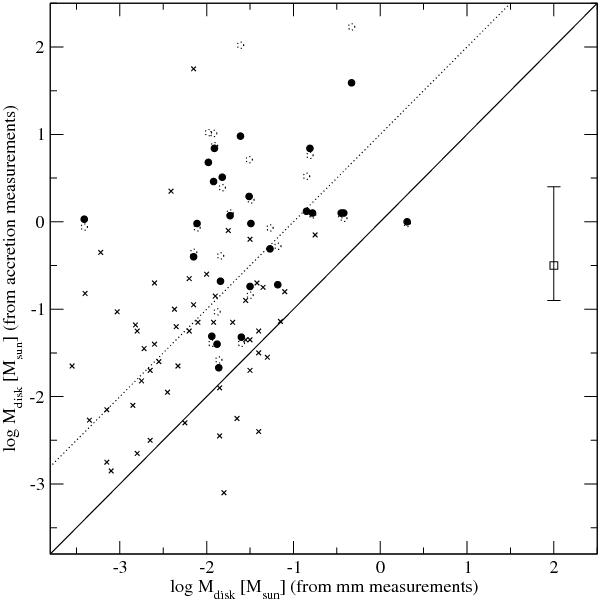
Disk masses from accretion versus those from dust emission at mm wavelengths. Crosses are T Tauri stars taken from Andrews & Williams (2007) and circles the estimates for our sample. The solid line represents equal values and the dotted line bisects both samples, indicating that disk masses from accretion are typically one order of magnitude larger than those from mm measurements. The filled circles are derived from Eq. (5) and η = 1.8. The error bar at the right side represents the uncertainty coming from using η = 1.1 (upper limit) or 3.2 (lower limit). The open-dotted circles are the estimates from Eq. (4), η = 1.8, and the theoretical times to reach the main sequence from Tayler (1994).
Current usage metrics show cumulative count of Article Views (full-text article views including HTML views, PDF and ePub downloads, according to the available data) and Abstracts Views on Vision4Press platform.
Data correspond to usage on the plateform after 2015. The current usage metrics is available 48-96 hours after online publication and is updated daily on week days.
Initial download of the metrics may take a while.