Fig. 6
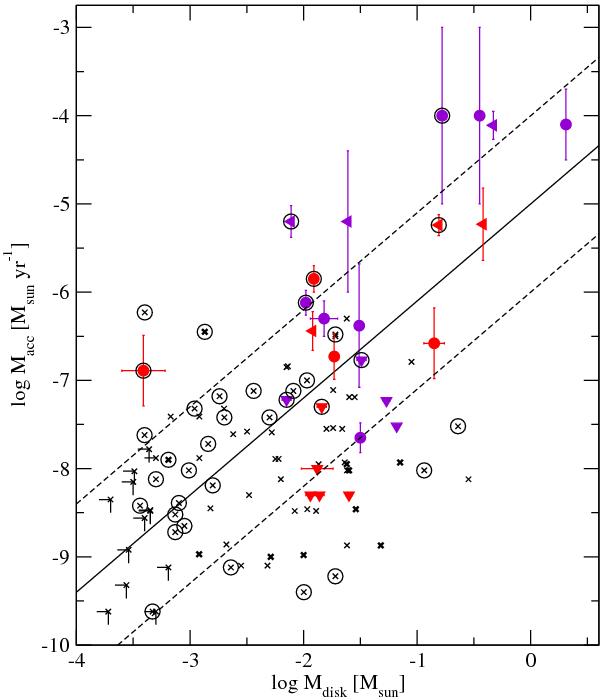
Mass accretion rate against disk mass. Crosses are T Tauri stars from Hartmann et al. (1998) and Najita et al. (2007). Dark crosses are transitional disks. The values for our 26 HAeBes with disk mass estimates are represented with solid symbols, triangles for the upper limits. Group JH stars are plotted in violet and group K stars in red. The solid line represents the best fit to our sample and the dashed lines ± 1 dex. The close binaries for both T Tauri and HAeBe stars are surrounded by solid circles.
Current usage metrics show cumulative count of Article Views (full-text article views including HTML views, PDF and ePub downloads, according to the available data) and Abstracts Views on Vision4Press platform.
Data correspond to usage on the plateform after 2015. The current usage metrics is available 48-96 hours after online publication and is updated daily on week days.
Initial download of the metrics may take a while.