Fig. 4
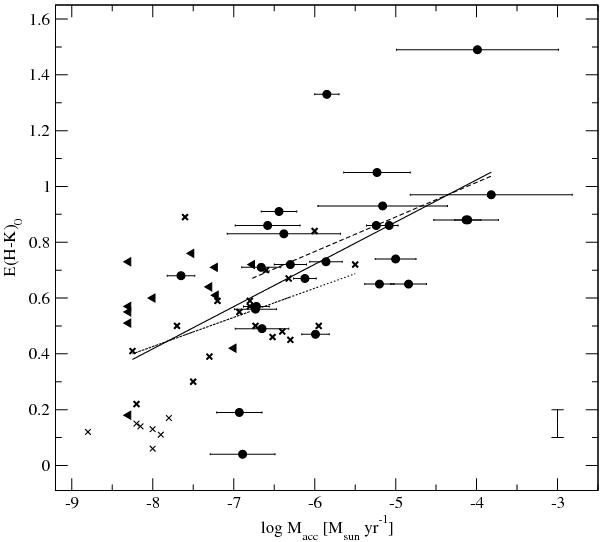
Intrinsic colour excess in H − K versus the mass accretion rate. The typical uncertainty for the colour is plotted close to the bottom right corner. Triangles are upper limits for the accretion rates. Crosses represent classical T-Tauri (boldface crosses) and weak T Tauri (normal crosses) stars from Meyer et al. (1997). The best fits are E(H − K)0 = 1.51( ± 0.26) + 0.12( ± 0.05) × log Ṁacc (dashed line, Pearson correlation coefficient 0.50) for HAeBes with Ṁacc > 1.5 × 10⁻⁷ M⊙ yr-1, E(H − K)0 = 1.26( ± 0.34) + 0.10( ± 0.05) × log Ṁacc (dotted line, Pearson correlation coefficient 0.50) for CTTs, and E(H − K)0 = 1.63( ± 0.17) + 0.15( ± 0.03) × log Ṁacc (solid line, Pearson correlation coefficient 0.65) for both HAeBes showing high accretion rates and CTTs.
Current usage metrics show cumulative count of Article Views (full-text article views including HTML views, PDF and ePub downloads, according to the available data) and Abstracts Views on Vision4Press platform.
Data correspond to usage on the plateform after 2015. The current usage metrics is available 48-96 hours after online publication and is updated daily on week days.
Initial download of the metrics may take a while.