Fig. 1
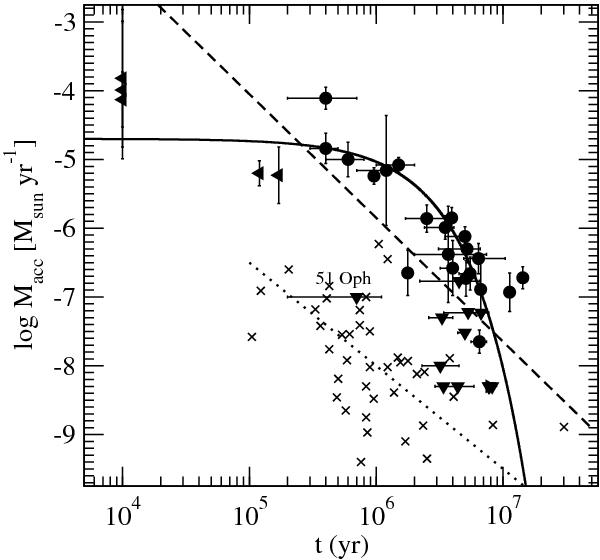
Mass accretion rates versus stellar age for our HAeBes (solid symbols, upper and lower limits are represented with triangles) and T Tauri stars from Hartmann et al. (1998) (crosses). The best fits for our sample are represented with solid and dashed lines, for the exponential (τ = 1.3 Myr) and power-law (η = 1.8
 ) expressions, respectively. 51 Oph was not considered for the fit. The dotted line is the best power-law fit for T Tauri stars (η ~ 1.5; see Hartmann et al. 1998; Calvet et al. 2000; Muzerolle et al. 2000).
Current usage metrics show cumulative count of Article Views (full-text article views including HTML views, PDF and ePub downloads, according to the available data) and Abstracts Views on Vision4Press platform.
Data correspond to usage on the plateform after 2015. The current usage metrics is available 48-96 hours after online publication and is updated daily on week days.
Initial download of the metrics may take a while.