Free Access
Fig. 5
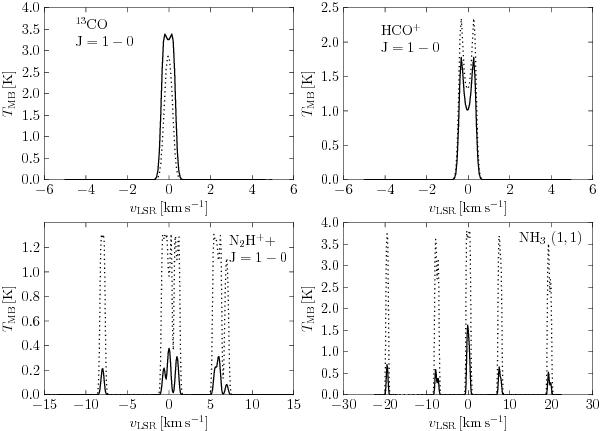
Simulated line emission profiles (molecules and transitions indicated in figure) in model B assuming a distance of 100 pc. Solid and dotted lines correspond to core ages of t = 105 years and t = 106 years, respectively. In the simulations, the beam width is set equal to the core radius (126″ at the assumed distance.)
Current usage metrics show cumulative count of Article Views (full-text article views including HTML views, PDF and ePub downloads, according to the available data) and Abstracts Views on Vision4Press platform.
Data correspond to usage on the plateform after 2015. The current usage metrics is available 48-96 hours after online publication and is updated daily on week days.
Initial download of the metrics may take a while.