Free Access
Fig. 3
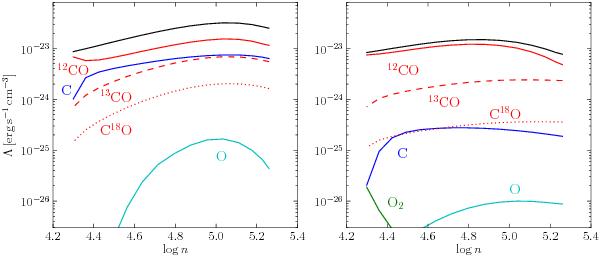
The cooling rates of the cooling molecules (indicated in the figure) at t = 105 years (left panel) and at t = 106 years (right panel) in model B as a function of gas density. Also plotted in both panels is the total cooling power (black lines).
Current usage metrics show cumulative count of Article Views (full-text article views including HTML views, PDF and ePub downloads, according to the available data) and Abstracts Views on Vision4Press platform.
Data correspond to usage on the plateform after 2015. The current usage metrics is available 48-96 hours after online publication and is updated daily on week days.
Initial download of the metrics may take a while.