Fig. 2
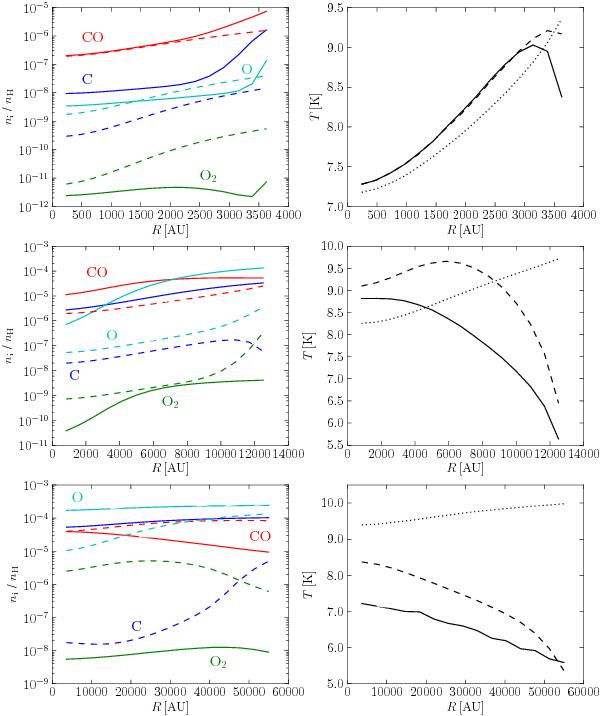
Left-hand panels: radial abundances (with respect to nH) of the cooling molecules (indicated in the figure) in models A (top), B (middle) and C (bottom). Solid lines correspond to t = 105 years, dashed lines to t = 106 years. Right-hand panels: the temperature profiles in models A to C. Solid lines correspond to t = 105 years, dashed lines to t = 106 years. Also plotted in each panel is the dust temperature (dotted lines).
Current usage metrics show cumulative count of Article Views (full-text article views including HTML views, PDF and ePub downloads, according to the available data) and Abstracts Views on Vision4Press platform.
Data correspond to usage on the plateform after 2015. The current usage metrics is available 48-96 hours after online publication and is updated daily on week days.
Initial download of the metrics may take a while.