Fig. 1
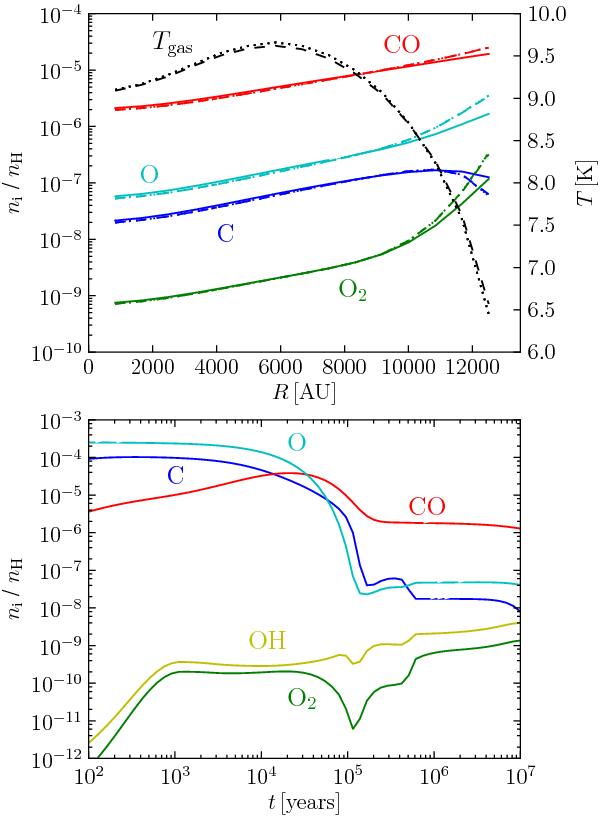
Upper panel: the abundances (with respect to nH, left-hand scale) of the cooling molecules (indicated in the figure) as a function of core radius in model B. Solid lines correspond to the initial chemistry calculation with Tgas = Tdust, other linestyles to subsequent iterations with Tgas ≠ Tdust. The black curves represent Tgas at different iterations (right-hand scale). Lower panel: the abundances of the cooling molecules and of OH as a function of time in a single-point chemical model with nH = 2.0 × 105 cm-3 and Tgas = Tdust = 9 K.
Current usage metrics show cumulative count of Article Views (full-text article views including HTML views, PDF and ePub downloads, according to the available data) and Abstracts Views on Vision4Press platform.
Data correspond to usage on the plateform after 2015. The current usage metrics is available 48-96 hours after online publication and is updated daily on week days.
Initial download of the metrics may take a while.