Fig. 6
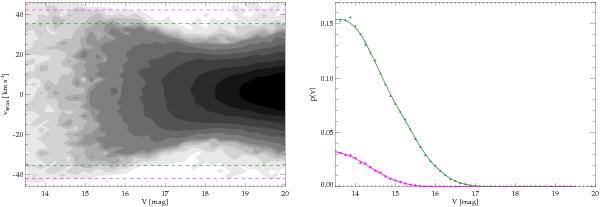
Monte Carlo simulations of recovering the radial velocities of v = 44 km s-1 and v = 37 km s-1 as a function of the magnitude of the star. The left panel shows the measured velocities of every spaxel from the 106 realizations as a density contour plot. The magenta and green lines mark the detection limits of 42 km s-1 and 35 km s-1 for FS1 and FS2 respectively. A spaxel with a velocity lower than 2 km s-1 (which corresponds to the error bars) minus the actual radial velocity is not considered to be a detection anymore. The right panel visualizes the probability of detecting a star with a radial velocity of 44 km s-1 (magenta) and 37 km s-1 (green) as well as their smoothed curves.
Current usage metrics show cumulative count of Article Views (full-text article views including HTML views, PDF and ePub downloads, according to the available data) and Abstracts Views on Vision4Press platform.
Data correspond to usage on the plateform after 2015. The current usage metrics is available 48-96 hours after online publication and is updated daily on week days.
Initial download of the metrics may take a while.