Fig. 20
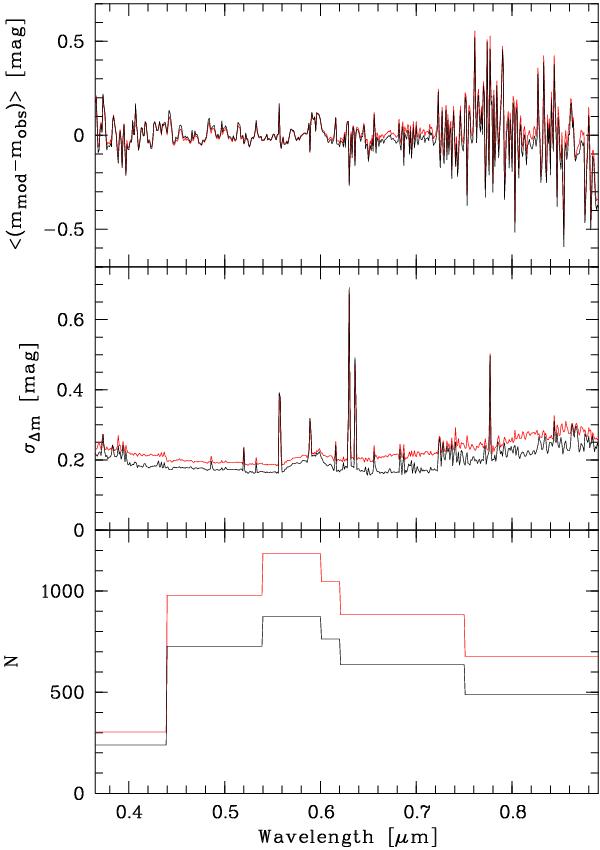
Deviations between the sky model and the observed FORS 1 spectra in magnitudes. The mean magnitude difference (upper panel), the standard deviation (middle panel), and the wavelength-dependent number of considered spectra (lower panel) are shown for 1 nm bins. Results for the full spectroscopic data set (red) and for spectra with the Moon below the horizon (black) are displayed.
Current usage metrics show cumulative count of Article Views (full-text article views including HTML views, PDF and ePub downloads, according to the available data) and Abstracts Views on Vision4Press platform.
Data correspond to usage on the plateform after 2015. The current usage metrics is available 48-96 hours after online publication and is updated daily on week days.
Initial download of the metrics may take a while.