Fig. 15
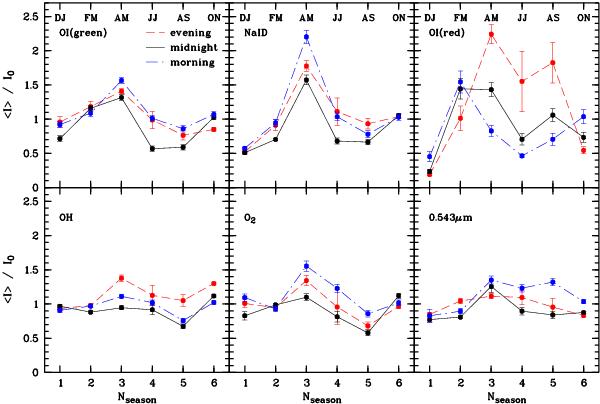
Variability correction factors and their errors depending on bimonthly period (1 = Dec./Jan., ..., 6 = Oct./Nov.) and night time (third of the night: evening, midnight, morning) for the five airglow line classes and the airglow continuum (analysed at 0.543 μm) of the sky model. Data points only differing in the bimonthly period are connected by lines.
Current usage metrics show cumulative count of Article Views (full-text article views including HTML views, PDF and ePub downloads, according to the available data) and Abstracts Views on Vision4Press platform.
Data correspond to usage on the plateform after 2015. The current usage metrics is available 48-96 hours after online publication and is updated daily on week days.
Initial download of the metrics may take a while.