Fig. 14
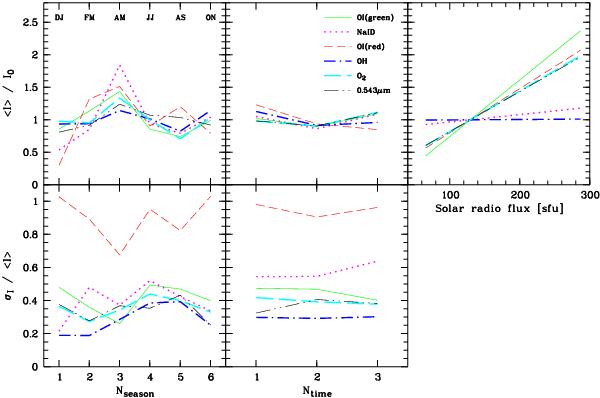
Variability correction for the five airglow line classes and the airglow continuum (analysed at 0.543 μm) of the sky model. Upper panels: the variability is shown as a function of the bimonthly period (1 = Dec./Jan., ..., 6 = Oct./Nov.), time bin (third of the night), and solar activity measured by the solar radio flux. Lower panels: for bimonthly period and time bin, the relative uncertainties of the variability correction are displayed.
Current usage metrics show cumulative count of Article Views (full-text article views including HTML views, PDF and ePub downloads, according to the available data) and Abstracts Views on Vision4Press platform.
Data correspond to usage on the plateform after 2015. The current usage metrics is available 48-96 hours after online publication and is updated daily on week days.
Initial download of the metrics may take a while.