Free Access
Fig. 13
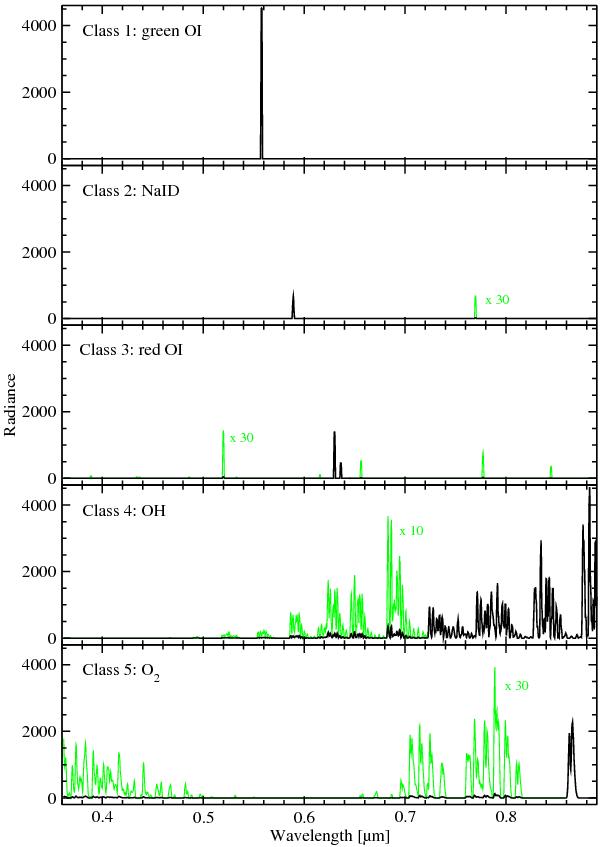
Variability classes for airglow emission lines. The following groups are defined: (1) green O I; (2) Na I D; (3) red O I; (4) OH; and (5) O2. The weak lines (green curves) are scaled by a factor of 30 for Na I D, red O I, and O2, and a factor of 10 for OH.
Current usage metrics show cumulative count of Article Views (full-text article views including HTML views, PDF and ePub downloads, according to the available data) and Abstracts Views on Vision4Press platform.
Data correspond to usage on the plateform after 2015. The current usage metrics is available 48-96 hours after online publication and is updated daily on week days.
Initial download of the metrics may take a while.