Fig. 12
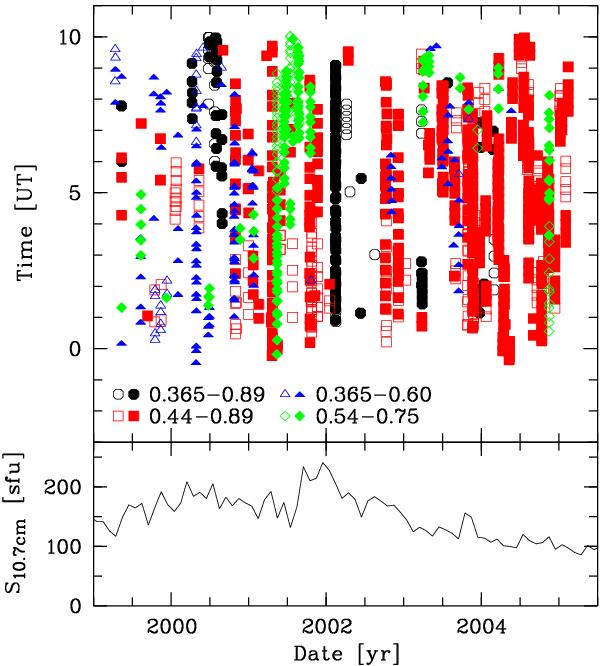
Date, time, and solar activity for the VLT FORS 1 observations of the Patat (2008) spectroscopic data set. The solar activity is given by the solar radio flux measured at 10.7 cm in sfu. The FORS 1 spectra were taken with different instrument set-ups, which are indicated by different symbols and colours. The plot legend identifies the different set-ups by their covered wavelength ranges in μm. Open symbols indicate that the data were taken with the Moon above the horizon, whereas filled symbols refer to dark-time observations.
Current usage metrics show cumulative count of Article Views (full-text article views including HTML views, PDF and ePub downloads, according to the available data) and Abstracts Views on Vision4Press platform.
Data correspond to usage on the plateform after 2015. The current usage metrics is available 48-96 hours after online publication and is updated daily on week days.
Initial download of the metrics may take a while.