Fig. 5
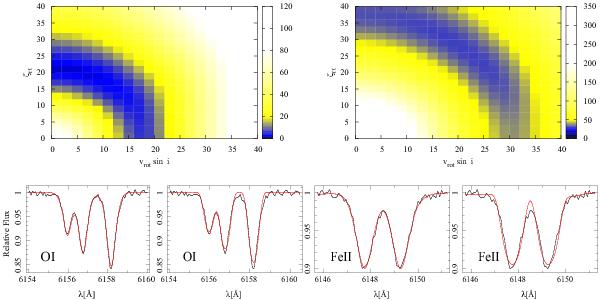
Examples for the derivation of vsini and ζ from the O i triplet around 6157 Å (left) in HD 207673 and the Fe ii pair around 6148 Å (right) in HD 14433. The upper panels show contour plots of a goodness-of-fit parameter in (vsini, ζ) space, lower values representing a better fit. The lower panels display the best line-profile-fits with and without macroturbulence (left and right, respectively).
Current usage metrics show cumulative count of Article Views (full-text article views including HTML views, PDF and ePub downloads, according to the available data) and Abstracts Views on Vision4Press platform.
Data correspond to usage on the plateform after 2015. The current usage metrics is available 48-96 hours after online publication and is updated daily on week days.
Initial download of the metrics may take a while.