Fig. 17
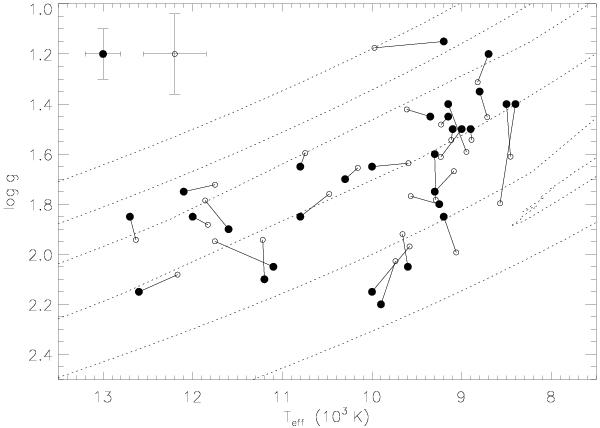
The sample stars with Strömgren photometric data in the Teff–log g plane. Solutions from the spectroscopic determination are shown as dots, open circles mark values that are obtained using photometric indicators according to our calibrations using [c1] and β. The two corresponding solutions are interconnected. Typical error bars are indicated in the upper left. Dotted lines mark evolution tracks for rotating stars at metallicity Z = 0.014 (Ekström et al. 2012), from 9 M⊙ to 32 M⊙ (bottom to top). The 9 M⊙ model shows a blue loop, partially displayed here.
Current usage metrics show cumulative count of Article Views (full-text article views including HTML views, PDF and ePub downloads, according to the available data) and Abstracts Views on Vision4Press platform.
Data correspond to usage on the plateform after 2015. The current usage metrics is available 48-96 hours after online publication and is updated daily on week days.
Initial download of the metrics may take a while.