Fig. 12
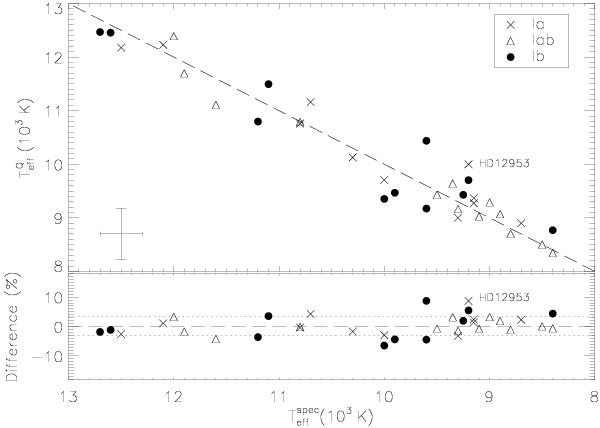
Upper panel: comparison of our spectroscopically derived
 with the Q-based
 computed with Eqs. (8)−(10). The dashed line indicates the 1:1 relation. The error bar
shows a typical conservative uncertainty from our spectroscopic determination, and
the uncertainty in , accounting for typical
uncertainties in the colours only. Lower panel:
percent difference of the two Teff-values for the
individual objects. These quantify the systematic differences
from application of our
Q–Teff calibrations. The dotted
lines indicate the 1σ-scatter range.
computed with Eqs. (8)−(10). The dashed line indicates the 1:1 relation. The error bar
shows a typical conservative uncertainty from our spectroscopic determination, and
the uncertainty in , accounting for typical
uncertainties in the colours only. Lower panel:
percent difference of the two Teff-values for the
individual objects. These quantify the systematic differences
from application of our
Q–Teff calibrations. The dotted
lines indicate the 1σ-scatter range.
Current usage metrics show cumulative count of Article Views (full-text article views including HTML views, PDF and ePub downloads, according to the available data) and Abstracts Views on Vision4Press platform.
Data correspond to usage on the plateform after 2015. The current usage metrics is available 48-96 hours after online publication and is updated daily on week days.
Initial download of the metrics may take a while.