Fig. 1
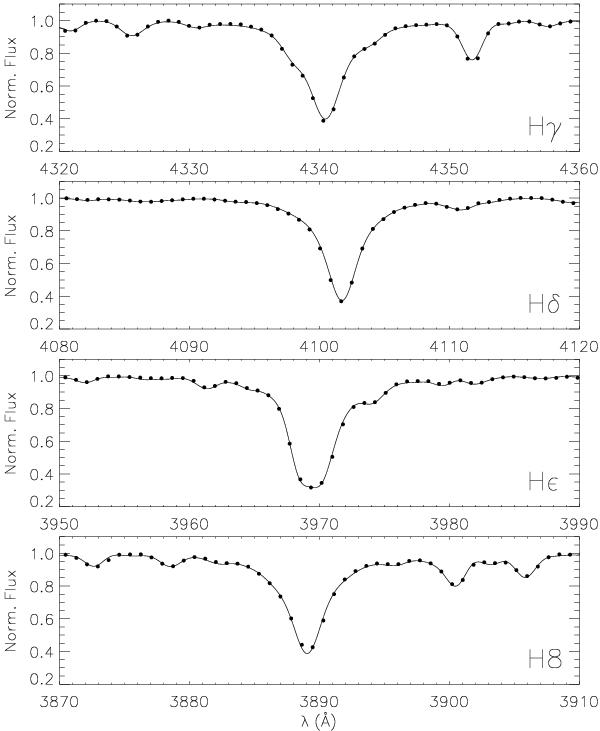
Comparison of our FOCES spectrum (full line) with a longslit spectrum from the NStars project (Gray et al. 2003, dots) in the region of the Balmer lines Hγ to H8 for Deneb (A2 Ia) to assess the quality of the normalisation of our echelle spectra. Note that the FOCES spectrum was was artificially degraded in resolution to match the 1.8 Å resolution of the longslit data.
Current usage metrics show cumulative count of Article Views (full-text article views including HTML views, PDF and ePub downloads, according to the available data) and Abstracts Views on Vision4Press platform.
Data correspond to usage on the plateform after 2015. The current usage metrics is available 48-96 hours after online publication and is updated daily on week days.
Initial download of the metrics may take a while.