| Issue |
A&A
Volume 543, July 2012
|
|
|---|---|---|
| Article Number | A35 | |
| Number of page(s) | 10 | |
| Section | Extragalactic astronomy | |
| DOI | https://doi.org/10.1051/0004-6361/201219033 | |
| Published online | 25 June 2012 | |
Near-infrared properties of asymptotic giant branch stars in nearby dwarf elliptical galaxy NGC 205⋆,⋆⋆
1 Department of Astronomy, Yonsei University, 120-749 Seoul, Korea
e-mail: This email address is being protected from spambots. You need JavaScript enabled to view it.
2 Yonsei University Observatory, 120-749 Seoul, Korea
3 Korea Astronomy and Space Science Institute, 305-348 Daejeon, Korea
4 CEOU, Department of Physics and Astronomy, Seoul National University, 151-742 Seoul, Korea
Received: 14 February 2012
Accepted: 10 May 2012
Abstract
Aims. We investigated the distribution of resolved asymptotic giant branch (AGB) stars over a much larger area than covered by previous near-infrared studies in the nearby dwarf elliptical galaxy NGC 205.
Methods. Using data obtained with the WIRCam near-infrared imager of the CFHT, we selected the AGB stars in the JHKs color − magnitude diagrams, and separated the C stars from M-giant stars in the JHKs color − color diagram.
Results. We identified 1,550 C stars in NGC 205 with a mean absolute magnitude of ⟨ MKs ⟩ = −7.49 ± 0.54, and colors of ⟨ (J − Ks)0 ⟩ = 1.81 ± 0.41 and ⟨ (H − Ks)0 ⟩ = 0.76 ± 0.24. The ratio of C stars to M-giant stars was estimated to be 0.15 ± 0.01 in NGC 205, and the local C/M ratios for the southern region are somewhat lower than those for the northern region. The (J − Ks) color distributions of AGB stars contain the main peak of the M-giant stars and the red tail of the C stars. A comparison of the theoretical isochrone models with the observed color distribution indicates that most of the bright M-giant stars in NGC 205 were formed at log (tyr) ~ 9.0−9.7. The logarithmic slope of the MKs luminosity function for M-giant stars was estimated to be 0.84 ± 0.01, which is comparable with dwarf elliptical galaxies NGC 147 and NGC 185. Furthermore, we found that the logarithmic slopes of the MKs luminosity function for C and M-giant stars are different to places, implying a different star formation history within NGC 205. The bolometric luminosity function for M-giant stars extends to Mbol = −6.0 mag, and that for C stars spans −5.6 < Mbol < −3.0. The bolometric luminosity function of C stars is unlikely to be a Gaussian distribution and the mean bolometric magnitude of C stars is estimated to be Mbol = −4.24 ± 0.55, which is consistent with our results for dwarf elliptical galaxies NGC 147 and NGC 185.
Key words: galaxies: individual: NGC 205 / galaxies: stellar content / stars: AGB and post-AGB
Based on observations carried out at the Canada-France-Hawaii Telescope, operated by the National Research Council of Canada, the Centre National de la Recherche Scientifique de France, and the University of Hawaii.
Calibrated photometry is only available at the CDS via anonymous ftp to cdsarc.u-strasbg.fr (130.79.128.5) or via http://cdsarc.u-strasbg.fr/viz-bin/qcat?J/A+A/543/A35
© ESO, 2012
1. Introduction
Dwarf galaxies are the most numerous galactic systems in the Universe, and most are found in galaxy groups. Photometric studies of stars resolved in dwarf galaxies provide clues for stellar evolution and star formation history in the galaxies. Dwarf galaxies in the Local Group (LG) are therefore excellent laboratories in which to study galaxy evolution. Among the bright resolved stars in LG dwarf galaxies, asymptotic giant branch (AGB) stars allow us to study the late evolutionary stages of stars with low and intermediate masses (~0.8 − 8 M⊙) as well as the star formation history in a galaxy of the intermediate age of 1 − 10 Gyr (Grebel 1999; Tolstoy 2003).
Stars in the AGB phase experience long-period pulsation variabilities, large mass loss through stellar winds, and a change in atmospheric chemical composition. During the thermal pulses (TP-AGB), material from the nuclear region is mixed into the outer layers (dredge-up process; Iben & Renzini 1983). Owing to this dredge-up, AGB evolution can be classified according to atmospheric abundance, i.e., starting with oxygen-rich (C/O < 1) M-giant stars that evolve into carbon-rich (C/O > 1) C stars (Nowotny et al. 2001). These two types of AGB stars can be used to estimate the metallicity of the parent galaxy because the ratio of C stars to M-giants (C/M) is anti-correlated with the metal abundance (Battinelli & Demers 2005; Cioni & Habing 2005; Cioni 2009). The AGB stars are among the brightest and coolest stars of the intermediate-age stellar population; accordingly, they appear mostly in near-infrared color − magnitude diagrams (CMDs). Furthermore, C stars are generally located in an extended red tail on near-infrared CMDs, and can be easily and clearly distinguished from M-giant AGB stars (Hughes & Wood 1990; Nikolaev & Weinberg 2000; Cioni & Habing 2003, 2005; Davidge 2003, 2005; Kang et al. 2005, 2006; Sohn et al. 2006; Valcheva et al. 2007). However, Battinelli et al. (2007) pointed out that near-infrared photometry only detects cool C stars and misses warm C stars, which can only be detected spectroscopically.
This paper is part of a series that studies the photometric properties of AGB stars in LG dwarf galaxies from near-infrared photometry. In previous papers (Kang et al. 2005, 2006; Sohn et al. 2006), we showed the near-infrared photometric properties of AGB stars in two dwarf elliptical galaxies (NGC 185 and NGC 147) and a dwarf irregular galaxy (NGC 6822). We also demonstrated that C stars can be distinguished from AGB stars using near-infrared colors. Kang et al. (2005) and Sohn et al. (2006) provided near-infrared photometric properties of 73 and 91 C stars in NGC 185 and NGC 147, respectively, and suggested that star formation in the galaxies has a wide range of ages for intermediate-age stars. In this paper, we investigate the near-infrared properties of resolved AGB populations in NGC 205, a dwarf elliptical satellite of a large spiral galaxy (M 31).
Of the three dwarf elliptical companions of M 31, NGC 205 has the shortest projected distance from the larger galaxy. It is therefore expected that NGC 205 has experienced a much stronger interaction with M 31 than NGC 147 and NGC 185, and consequently has evolved differently. Indeed, many studies support this idea based on photometric and kinematics observations: the presence of young blue stars in the central region of NGC 205 (e.g., Cappellari et al. 1999); AGB stars in NGC 205 that show multiple episodes of star formation during the past gigayear (Davidge 2003); the twisted surface isophotes and a subtle downward break in the surface brightness profile in NGC 205 (Choi et al. 2002); the presence of stellar tidal debris possibly associated with NGC 205 (Demers et al. 2003; Ibata et al. 2001; McConnachie et al. 2004); the dynamically distinct behavior of gas in NGC 205 (Young & Lo 1997; Welch et al. 1998); the estimation of the dust mass associated with the last burst of star formation in NGC 205 (Fich & Hodge 1991; Haas 1998; Marleau et al. 2006); a steadily increasing velocity dispersion with radius (Simien & Prugniel 2002); and a turnover in the major-axis velocity profile of NGC 205 at a radius of 4.5′ (~1 kpc; Geha et al. 2006). To summarize, NGC 205 contains young stars, gas, and dust, whicj all imply recent star formation within a 1′ radius, beyond which the galaxy is free from gas and dust. This area also contains intermediate-age stars. NGC 205 furthermore shows the typical surface brightness and kinematics of a normal dwarf elliptical galaxy within an effective radius (~2.5′). However, beyond this radius, there is strong evidence of tidal distortion in the photometry and kinematics of NGC 205 (Choi et al. 2002; Geha et al. 2006).
Even though there is a strong interaction between M 31 and NGC 205, the process that triggered star formation in the central region of NGC 205 is still being debated. Some studies concluded that the latest star formation activities that occurred a few 108 yr ago in the central region of NGC 205 might have been triggered by past interactions with M 31 (Davidge 2003; Butler & Martínez-Delgado 2005), while Monaco et al. (2009) recently argued against the tidally triggered star formation; instead they suggested a constant star formation, at least over the past approximately 650 Myr. Moreover, Howley et al. (2008) apparently interpreted the continuous star formation as being in line with the latest simulations of the NGC 205 orbit, where the authors found that the galaxy had its first interaction with M 31, tangentially moving with a high velocity of 300 − 500 km s-1 from northwest to southeast.
Several studies have been devoted to investigating the stellar contents of resolved AGB and C stars toward NGC 205. Demers et al. (2003) applied the four-band photometric technique (proposed by Cook et al. 1986) using CN and TiO narrow bands to identify C stars and found 532 C stars in 42′ × 28′ fields centered on NGC 205. The estimated C/M ratio of NGC 205 in a 10′ ellipse is 0.09 ± 0.01 with 289 C stars. Davidge (2003) has detected 320 C stars from JHK′ images of 3.6′ × 3.6′ field in the center of NGC 205. These authors found AGB stars formed within the past 0.1 Gyr and the previous episode of star formation occurred a few tenths of a Gyr earlier, which is consistent with star formation in NGC 205 being triggered by interactions with M 31. Although Davidge (2005) also used intermediate-age stars within an effective radius and different color criteria to identify C stars, in this study we collected near-infrared photometric data for stars in a much wider area to study the properties of intermediate-age stars that reside in the tidally distorted region.
In this paper, we investigate the bright AGB stellar populations of the central ~24′ × 24′ of the nearby dwarf elliptical galaxy NGC 205 through near-infrared photometry. Section 2 presents JHKs observations of NGC 205, the data reduction procedure, and photometric measurements of the resolved stars. The CMDs and color − color diagrams (CCDs) of resolved stars based on JHKs photometry are presented in Sect. 3. In Sect. 4, we discuss the near-infrared photometric properties of the identified C stars along with the distribution of the C/M ratio, the color distributions, and the luminosity functions of the AGB stars. A summary of the results is given in Sect. 5.
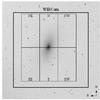 |
Fig. 1 Digitized Sky Survey image of NGC 205. The whole field-of-view is 32′ × 32′ with north up and east to the left. The WIRCam field covers a ~24′ × 24′ area in the central area of NGC 205 (thick line). The six regions of ~6′ × 11′ are divided to investigate the spatial dependence of the photometric properties of C stars in NGC 205 (thin line). |
2. Observation, data reduction, photometry, and photometric measurements
We obtained JHKs images via Queued Service Observing (QSO) with the WIRCam (a wide-field near-infrared detector; Puget et al. 2004) at the 3.6 m CFHT on July 19, 2007. The WIRCam contains four 2048 × 2048 HgCdTe arrays with a sampling of 0.3″ per pixel, so that each image covers a total field-of-view of ~21′ × 21′ of the sky. The total integration times on the central field of NGC 205 were 600s (J), 300s (H) and 500s (Ks), which were obtained from individual exposures of 30s (J), 15s (H) and 25s (Ks) with a five-point dithering pattern by 90″ offset to fill-in the 45″ gaps between arrays. At each pointing, the data were acquired using four half-pixel micro-dithering to improve the spatial resolution. Figure 1 shows the observed fields, and a summary of the observation is presented in Table 1.
Each image was detrended (dark-subtraction, flat-fielding, etc.) using the “I”iwi1 preprocessing pipeline provided by the QSO team. After we subtracted the sky background level from each detrended image, we subtracted the thermal signatures using median combined flat-fielded images of blank sky regions. Then, we used TERAFIX2 software products (SExtractor, SCAMP, WeightWatcher, SWarp) to correct the distortion and chip-to-chip variation, and then co-added into one final mosaic image with the full exposure time of a ~24′ × 24′ field-of-view. The seeings measured from the final images were about 0.52″−0.55″ FWHM in J, H and Ks.
Observational log of July 19, 2007.
We used the point-spread-function (PSF) fitting routines DAOPHOT II/ALLSTAR (Stetson & Harris 1988; Stetson 1987) to measure stellar brightness. We adopted a threshold value of the DAOPHOT sharp parameter (sharpness of 0.3 − 1.4) to weed out extended objects in the photometry, although this is complicated at the faint part. The instrumental magnitudes of JHKs were photometrically calibrated using stars with 14 < Ks < 15 in the 2MASS Point Source Catalog (Cutri et al. 2003) over the same area. A total of 145,246 stars were detected in JHKs filters on the ~24′ × 24′ field of the WIRCam observations.
Completeness fractions and uncertainties in the photometric measurements were estimated by performing artificial star experiments on the JHKs images. Only 400 artificial stars were added to each experiment to take into account increasing uncertainties such as stellar density increases. In the left panel of Fig. 2, a total of 10 000 artificial stars from 25 experiments were added to the final mosaic JHKs images with a field-of-view of 24′ × 24′. Each horizontal panel in Fig. 2 shows the completeness fraction defined as the recovery rate of the input artificial stars, the rms difference in magnitudes (ΔM) between the measured and the input brightness, and the standard deviation of ΔM (σ). When J, H and Ks are fainter than 20.9, 20.0 and 19.5 mag, respectively, the completeness is less than ~90%. To check the completeness difference as a function of stellar density, we also performed 36 new experiments by adding 400 artificial stars of Ks = 15.5 − 18.5 mag in each experiment with increasing projected radius from the center of NGC 205 (α = 00h40m22.08s, δ = +41°41′07.10″). The right panel of Fig. 2 shows the results of the experiments as a function of the projected radius (Rc) from the center of NGC 205. We only considered stars brighter than Ks = 18.1 mag because we assumed that AGB stars are brighter than Ks = 18.1 mag in Sect. 3.2. Although the completeness slightly decreases in the central area (Rc < 1.5′), it is not less than ~90%. This suggests that incompleteness is not significant for our analysis.
 |
Fig. 2 Left: the results of artificial star experiments on the stacked JHKs images (dashed, dotted, and solid lines) of a ~24′ × 24′ field of the WIRCam observation. Right: the results of the experiments as a function of the projected radius (Rc) from the center of NGC 205. Only stars brighter than Ks = 18.1 mag were considered because we assumed that AGB stars are brighter than Ks = 18.1 mag in Sect. 3.2. The completeness is the number of recovered artificial stars divided by the total number of added stars. ΔM (mag) is the mean difference between the actual input magnitudes and the measured magnitudes by DAOPHOTII/ALLSTARS, and σ (mag) is the standard deviation of the ΔM. |
3. Photometric properties of AGB stars
3.1. Adopted reddening, distance, and metallicity range
NGC 205 is the closest dwarf elliptical galaxy to M 31 (located at 37′ from the center of M 31) and behind M 31 (Grebel et al. 2003; Howley et al. 2008); the accurate color excess toward NGC 205 is not known yet because of M 31’s dust clouds. Schlegel et al. (1998) estimated the foreground reddening (generated by the Galaxy) of E(B − V) = 0.083 from the dust infrared emission feature. Adopting this value and applying the relative extinction ratios of Schlegel et al. (1998), we estimated the interstellar absorptions in JHKs passbands to be AJ = 0.075, AH = 0.048, and AKs = 0.030. The calculated reddening values are then E(J − Ks) = 0.045 and E(H − Ks) = 0.018.
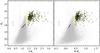 |
Fig. 3 (J − Ks,Ks) and (H − Ks,Ks) CMDs for stars detected in JHKs bands of the total WIRCam observed area (only 20% of stars randomly selected in the total sample are shown with gray dots). The isochrones are limited to the maximum mass-loss rate on the TP-AGB with no-dust case. The estimated color and magnitude range of the TRGB (Valenti et al. 2004) at the distance of NGC 205 also are presented with thick slanted lines. Arrows indicate the estimated TRGB magnitude in Ks with Ks = 18.1. The yellow plus symbol denotes C stars selected in RICNTiO photometry (Demers et al. 2003), and the open circles represent 309 C stars cross-identified in JHKs photometry (in this work) and RICNTiO photometry (Demers et al. 2003). |
McConnachie et al. (2005) measured the distance modulus of NGC 205 as (m − M)0 = 24.58, based on the I-band tip of red-giant branch (TRGB) brightness. From investigating the interaction between NGC 205 and M 31 with restricted N-body simulations, Howley et al. (2008) estimated a distance modulus of (m − M)0 = 24.50. However, we adopted an unweighted mean distance modulus of NGC 205 as (m − M)0 = 24.54 ± 0.09 (van den Bergh 2000).
Mould et al. (1984) measured a metallicity of [Fe/H] ≳ − 0.9 ± 0.2 and a metallicity dispersion of ± 0.5 dex, based on the color of the RGB stars in NGC 205. However, Jones et al. (1996) estimated a much lower nuclear metallicity of [Fe/H] ~ −1.4 from the far-UV imaging data. McConnachie et al. (2005) also obtained the median metallicity of [Fe/H] = −0.8 (using theoretical evolutionary tracks with no α-enhancement) for the RGB stars in NGC 205. Using HST observations of the central region of NGC 205, Butler & Martínez-Delgado (2005) inferred the median metallicity of [Fe/H] ≳ −1.06 ± 0.04 from ancient stars’ color information, reaching [Fe/H] ≳ − 0.7 for the RGB stars that were the most metal-rich. The central region has also been observed spectroscopically. Bica et al. (1990) showed that the dominant population is young (a few 108 years) with a maximum metallicity of [Fe/H] = − 0.5, and much older stars with [Fe/H] ≳ −1.0. Sharina et al. (2006), from a spectroscopic study of integrated light from stars in the central regions of NGC 205, found a mean metallicity of [Fe/H] ~ −0.5 with a wide spread of metallicity ~0.3−0.4 dex. These studies indicate that NGC 205 has widespread metallicity in the range of [Fe/H] = −1.4 to −0.5. Unless the age-metallicity relation in NGC 205 is peculiar, intermediate-age stars in NGC 205 should have metallicities that tend toward the higher end of the metallicity range found in the literature.
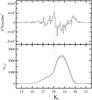 |
Fig. 4 Lower: the Ks band luminosity function (LF) of the resolved stars in NGC 205. Black line is the LF for the measured stars, and the gray line is that for the completeness-corrected number of stars. Upper: the second derivatives of the observed LF and the completeness-corrected LF. Vertical dotted lines in each panel indicate the determined magnitudes of the TRGB (i.e., Ks = 18.1 mag). |
3.2. Color–magnitude diagrams (CMDs) and selection of AGB stars
Figure 3 shows near-infrared (J − Ks,Ks) and (H − Ks,Ks) CMDs for resolved stars in the entire observed area of NGC 205. Using the empirical relations between TRGB brightness in near-infrared bands and metallicity for stars in a galaxy (Valenti et al. 2004), we estimated the range of the magnitude and color of the TRGB for the given metallicity range [Fe/H] = − 1.4 ~ − 0.5 of NGC 205. The thick lines in Fig. 3 are the range of Ks magnitudes and the colors of the TRGB at the adopted distance and metallicity range of NGC 205 (17.88 < Ks < 18.40, 0.96 < (J − Ks) < 1.24, and 0.13 < (H − Ks) < 0.23).
To confirm the discontinuity in star counts near the expected location of the TRGB, we applied the procedure of Cioni et al. (2000). The TRGB discontinuity causes a peak in the second derivative of the observed LF, which is derived by using a Savitzky-Golay filter. The filter yields for bin number i, ![Mathematical equation: \hbox{$[{\rm d}^{2}N/{\rm d}m^{2}]_{i} = \Sigma^{J}_{j=-J}c_{j}N(m)_{i+j}$}](/articles/aa/full_html/2012/07/aa19033-12/aa19033-12-eq129.png) , where N(m) is number of stars with m magnitude and the cj are Savitzky-Golay coefficients for the chosen value of J and the desired derivative order L = 2. The filter fits a polynomial on the order of M to the data points N(m)j with j = iJ,...,i + J, and then evaluates the Lth derivative of the polynomial at bin i to estimate d2N/dm2. By applying the Savitzky-Golay filter to the observed LF in Ks band, we derived the second derivatives of LF per 0.07 mag interval, and detected a peak of the second derivatives caused the TRGB discontinuity with ~ 18.1 mag in Ks in Fig. 4.
, where N(m) is number of stars with m magnitude and the cj are Savitzky-Golay coefficients for the chosen value of J and the desired derivative order L = 2. The filter fits a polynomial on the order of M to the data points N(m)j with j = iJ,...,i + J, and then evaluates the Lth derivative of the polynomial at bin i to estimate d2N/dm2. By applying the Savitzky-Golay filter to the observed LF in Ks band, we derived the second derivatives of LF per 0.07 mag interval, and detected a peak of the second derivatives caused the TRGB discontinuity with ~ 18.1 mag in Ks in Fig. 4.
From these approaches, we consider that AGB stars are located at brighter than Ks = 18.1 mag, and 11,928 stars are accordingly selected as AGB stars. The bright part for AGB stars has three different components in Fig. 3. The bright blue sequence at (J − Ks) < 0.97 mostly corresponds to the Galactic foreground stars, and a vertical sequence (0.97 < J − Ks < 1.43) and a red plume (J − Ks > 1.43) to the M-giant and C stars (Davidge 2003). The Galactic star count model of Ratnatunga & Bahcall (1985) predicted approximately 550 bright blue foreground stars with (B − V) < 1.3 and V < 22 in the ~ 24′ × 24′ region of the WIRCam observation toward NGC 205, which is roughly consistent with the count of the bright foreground stars in Fig. 3. It should be noted that the faint part for AGB stars may be contaminated from unresolved background galaxies. According to McCracken et al. (2000, see their Fig. 1), there are ~ 4000 galaxies deg2 when 16 < Ks < 18.1 (magnitude range of AGB stars in Fig. 5). This implies that ~ 640 galaxies (16 < Ks < 18.1) might be present in the WIRCam field. In other words, at most ~ 5% of our AGB stars are probably intermediate-redshift galaxies. We here assume that all types of background galaxies (16 < Ks < 18.1) will have (J − Ks) ~ 1.0 − 2.0 from Cowie et al. (1996), applying the colors of galaxies and the k-corrections from Mannucci et al. (2001).
To confirm the population classification, we compare the observed (J − Ks,Ks) CMD shown in Fig. 5 for stars brighter than Ks = 18.1 with the theoretical isochrones of AGB stars (Marigo et al. 2008). We also plot the C stars identified in RICNTiO photometry (Demers et al. 2003). Although C stars are broadly distributed over the CMD, most of the M-giants and C stars are clearly separated in the CMD (see Fig. 7 in Marigo et al. 2008). Figure 6 shows (J − Ks) colors versus ages at the beginning of the C stars on the isochrones, i.e., C/O > 1. The dotted line indicates the color cut of (J − Ks) = 1.43 to separate C stars from M-giants in the work.
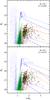 |
Fig. 5 Theoretical isochrone of log (tyr) = 8.2,9.1, and 10.0 with Z = 0.008 (upper) and Z = 0.019 (lower) (Marigo et al. 2008) on the near-infrared (J − Ks,Ks) CMD of NGC 205. The different isochrone colors show different evolutionary states. The green line corresponds to pre-TP-AGB stars, and the blue and orange lines represent M-giant stars and C stars, respectively. The different dust obscuration models are represented by different line types; continuous lines for the no-dust, dot-dashed lines for Bressan et al. (1998), and dashed lines for Groenewegen (2006) (the 0.85 AMC + 0.15 SiC mixture for C stars, and 0.6 silicate + 0.4 AlOx mixture for M-giant stars). The Galactic foreground stars with blue dots and the AGB star (green: M-giants, and red: C stars) dots are divided at (J − Ks) = 0.97. The yellow plus and open circle symbols are the same as those in Fig. 3. |
3.3. Color–color diagrams (CCDs) and selection of C stars
The narrowband photometric technique (i.e., CN − TiO approach) for differentiating C stars from M-giants is based on different spectrum types of AGB stars, i.e., M-giants dominated by bands of the TiO molecule and C stars dominated by bands of the C2 and CN molecules (Albert et al. 2000; Battinelli & Demers 2000, 2004a,b; Nowotny et al. 2001, 2003; Demers & Battinelli 2002; Letarte et al. 2002; Battinelli et al. 2003; Demers et al. 2003; Harbeck et al. 2004; Kerschbaum et al. 2004). However, the extremely red C stars can be easily separated from the M-giants because they have different locations on the near-infrared color − color diagrams (Frogel et al. 1980; Wood et al. 1985; Marigo et al. 2003; Davidge 2005; Kang et al. 2005, 2006; Sohn et al. 2006).
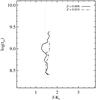 |
Fig. 6 Function of age vs. the (J − Ks) color at the appearing C stars on the isochrones, i.e., C/O > 1, for the no-dust case (Marigo et al. 2008). The range of ages is log (tyr) = 8.40 − 9.40 with Z = 0.008 (solid line), and log (tyr) = 8.40 − 9.15 with Z = 0.019 (dot-dashed line). The dotted line represents the adopted color cut of (J − Ks) = 1.43 to separate C stars from M-giant stars. |
 |
Fig. 7 (H − Ks) − (J − Ks) color − color diagram and color histograms of (H − Ks) (upper) and (J − Ks) (right) for selected AGB stars. The dotted lines and arrows represent the color cuts of (J − Ks) = 1.43 and (H − Ks) = 0.47 to separate C stars from M-giants. The green and red dots correspond to M-giants and C stars, respectively. The yellow plus and open circle symbols are the same as those in Figs. 3 and 5. |
Demers et al. (2003) identified 532 C stars in NGC 205 from their position on the (CN − TiO) versus (R − I) CCD, using a CFH12K survey covering a field of view of 48′ × 28′ in NGC 205. By applying their criterion for selecting C stars (i.e., C stars: (R − I) > 0.97,(CN − TiO) > 0.3, M-giants: (R − I) > 0.97,(CN − TiO) < 0.0), we found 394 C stars and 5,054 M-giant stars with Ks magnitude brighter than 18.1 in our WIRCam field. We note, however, that it may possibly contain fainter stars than TRGB brightness. Davidge (2005) assigned the color limits of (J − Ks)0 > 1.4 and (H − Ks)0 > 0.45 to detach C stars from M-giants in nearby dwarf galaxies. Adopting these color cuts to NGC 205, C stars were separated from M-giants at (J − Ks) > 1.43 and (H − Ks) > 0.47. Figure 7 shows the (H − Ks) − (J − Ks) CCD and color histograms of selected AGB stars with the color cuts of C stars. Most C stars selected in RICNTiO photometry are also distributed in the color range of C stars in the (H − Ks) − (J − Ks) CCD, and the color distribution shows the main peak of M-giants and the red tail of C stars. Finally, 1,550 C stars were selected from the CCD among the observed 11,928 AGB stars of NGC 205. Among the C stars selected in JHKs, 309 C stars matched RICNTiO photometry (Demers et al. 2003). The cross-identified C stars are marked with open circles in Figs. 3, 5, and 7. We can speculate that there is an obvious deficiency of Demers’s C stars near the center of NGC 205 due to crowding, as Demers et al. (2003) also mentioned in their Fig. 6. The seeing in JHKs images (0.52″–0.55″) was better than in RICNTiO images (0.8″), and Demers et al. (2003) also mentioned that sky conditions during the observations were nonphotometric. Therefore, more C stars could be discovered in JHKs images. Furthermore, Davidge (2005) found 387 C stars near the center of NGC 205 (3.7′ × 3.7′) using CFHTIR JHK data, although they adopted a different faint limit for C stars than we did. Therefore, the main reason for the difference in C stars compared to Demers and coworkers is that they missed several C stars near the center of NGC 205.
4. Discussion
4.1. C stars and the distribution of the C/M ratio
The mean magnitude and colors of the 1,550 C stars, which are classified in the JHKs bands, are estimated to be ⟨ Ks ⟩ = 17.08 ± 0.54, ⟨ (J − Ks) ⟩ = 1.85 ± 0.41, and ⟨ (H − Ks) ⟩ = 0.78 ± 0.24. The corrected values are ⟨ MKs ⟩ = −7.49, ⟨ (J − Ks)0 ⟩ = 1.81, and ⟨ (H − Ks)0 ⟩ = 0.76, with the distance modulus and reddening values in Sect. 3.1. For the cross-identified 309 C stars detected in common in the RICNTiO bands by Demers et al. (2003) and JHKs bands in this study, the mean absolute magnitude and colors are estimated to be ⟨ MKs ⟩ = −7.73 ± 0.40, ⟨ (J − Ks)0 ⟩ = 1.72 ± 0.30, and ⟨ (H − Ks)0 ⟩ = 0.67 ± 0.18. In our previous studies, the estimated mean absolute magnitude in the K band of C stars in nearby dwarf galaxies, ⟨ MK ⟩ is − 7.93 ± 0.38 for 73 C stars in NGC 185 (Kang et al. 2005), − 7.56 ± 0.47 for 91 C stars in NGC 147 (Sohn et al. 2006), and −7.60 ± 0.50 for 141 C stars in NGC 6822 (Kang et al. 2006).
To investigate the spatial distribution of the C stars of NGC 205, we divided the observed WIRCam field of a ~24′ × 24′ area into six ~6′ × 11′ regions as shown in Fig. 1. Table 2 summarizes the mean magnitude and colors for the C stars found in each region. The mean magnitude of the C stars is slightly brighter in the central part (i.e., “N” and “S” regions), with many more C stars than that of the C stars in the outer part.
Mean magnitude and colors of the selected 1,550 C stars in NGC 205.
 |
Fig. 8 Histogram distributions of (J − Ks) colors for the resolved 11,928 AGB stars of the WIRCam fields (left) and the AGB stars in each region (right). The standard deviation (σJ − Ks) is the 1σ deviation estimated by the Gaussian fitting of the histogram. |
We estimate the ratio of the C stars to M-giants (C/M) of the AGB population to be 0.15 ± 0.01 at the WIRCam observed field of NGC 205. As seen in Table 3, we did not find any spatial difference in the local C/M ratio of NGC 205. Instead, the mean C/M ratio in the southern part seems to be slightly lower than in the northern part. This implies that the star formation history for AGB stars in NGC 205 is likely to be different for the northern and southern parts. Alternatively, the difference in C/M ratios between the northern and southern parts of NGC 205 might be caused by contamination from the disk of M 31, which lies immediately to the south of NGC 205. The M 31 disk is more metal-rich than NGC 205 and consequently will have a lower C/M ratio. Presumably, a significant fraction of the stars in the southern half of the NGC 205 field belong to the M 31 disk. Demers et al. (2003) found 289 C stars and evaluated the C/M ratio in the central 10′ ellipse of NGC 205 as 0.09 ± 0.01, using the CN − TiO technique to identify C stars. To examine the difference in the C/M ratios, we applied the color criterion of Demers et al. (2003) (C stars: (R − I)0 > 0.9 and (CN − TiO) > 0.3; M-giants: (R − I)0 > 0.9 and (CN − TiO) < 0.0) to our C and M-giant stars identified in JHKs photometry and found 394 C stars and 5,054 M-giants. The calculated C/M ratio in the observed WIRCam field of NGC 205 is 0.08 ± 0.01. Therefore, the difference in the C/M ratio is largely due to the method for defining the M-giants and C stars of the AGB population.
Number of C stars and M-giants, C/M ratio, and metallicity in NGC 205.
The C/M ratio of the LG galaxies correlates with metallicity, for instance, a lower C/M ratio corresponds to a higher metallicity (Groenewegen 1999; Marigo 2002). Battinelli & Demers (2005) obtained C/M ratios for the LG galaxies, and found the correlation [Fe/H]a = −1.32( ± 0.07) − 0.59( ± 0.09) × log (C/M). Updating the metallicities for LG galaxies, the correlation is calibrated as [Fe/H]b = −1.39( ± 0.06) − 0.47( ± 0.10) × log (C/M) (Cioni 2009). Using these correlations, we calculated [Fe/H] = −0.79 ~ −1.02 in the WIRCam observed area of NGC 205. Table 3 summarizes the number of C stars and M-giants, C/M ratios, and metallicities of NGC 205. Battinelli et al. (2007) argue that applying C/M (obtained from RICNTiO) vs. [Fe/H] calibration to C/M (obtained from JHKs) vs. [Fe/H] calibration is not justified. Therefore, a more uniform data set for the LG galaxies are needed to confirm the correlation in the near-infrared wavelengths.
In previous studies, the estimated C/M ratios of the two elliptical satellites of M 31 are 0.11 ± 0.01 for NGC 185 (Kang et al. 2005) and 0.16 ± 0.02 for NGC 147 (Sohn et al. 2006). And the derived metallicities [Fe/H] are − 0.76 ± 0.03 and −0.86 ± 0.03 from Battinelli & Demers (2005), and −0.95 ± 0.03 and − 1.02 ± 0.02 from Cioni (2009), for NGC 185 and NGC 147, respectively. This indicates that the metallicity of NGC 205 is more similar to NGC 147 than to NGC 185. However, the color criteria for selecting C stars from M-giants are different for each galaxy. Accordingly, we re-estimated the C stars of NGC 147 and NGC 185, using the color criteria for NGC 205 (i.e., (J − K)0 > 1.4 and (H − K)0 > 0.45). As a result, the C/M ratios are 0.18 ± 0.02 in NGC 185 and 0.17 ± 0.02 in NGC 147. The derived metallicities [Fe/H] are then −0.88 ± 0.03 and −0.86 ± 0.03 from Battinelli & Demers (2005), and − 1.04 ± 0.02 and −1.03 ± 0.02 from Cioni (2009), for NGC 185 and NGC 147, respectively. This result suggests that the metallicities of the three dwarf elliptical satellites of M 31 are not very different, although the observed areas of two galaxies are much smaller than NGC 205. The relative metallicities of these three galaxies can also be compared from the luminosity-metallicity (MB vs. [Fe/H]) relation obtained by using oxygen abundances of HII regions for dwarf irregular galaxies (van Zee et al. 2006). The metallicities of NGC 147, 185, and 205 are estimated to be −1.12, −1.14, and − 0.94, respectively. We here assumed that 12 + log (O/H)⊙ = 8.66 (Asplund 2003) and used the relation [Fe/H] = [O/H] − 0.37 (Mateo 1998). It should be noted that at a fixed luminosity, dwarf ellipticals have a higher metallicity than dwarf irregulars. Therefore, the derived metallicities from the relationship can be slightly underestimated (e.g., Gonçalves et al. 2007).
4.2. Color distributions
Figure 8 shows the histogram distributions of the (J − Ks) color for the selected 11,928 AGB stars (left), and for AGB stars belonging to each region (right) in NGC 205. All histograms of (J − Ks) have the main peak of M-giant stars and the red tail of C stars. The shapes of the color distributions for AGB stars in each region do not show significantly different features from the color distribution for all selected AGB stars. However, the standard deviation (σJ − Ks) of the eastern part (i.e., “NE” and “SE”) is larger than that of the western part (i.e. “NW” and “SW”), indicating a much wider range of stellar ages in the eastern area of NGC 205 because the color distribution of AGB stars can be used to infer the intermediate-age stellar populations in a galaxy (Davidge 2005; Kang et al. 2005, 2006; Sohn et al. 2006). However, this difference is possibly due to contamination of the color distributions from some foreground stars and/or stars belonging to M 31.
In our previous studies (Kang et al. 2005, 2006; Sohn et al. 2006), we used the color distributions of NGC 185, NGC 147, and NGC 6822 to infer the range of ages for intermediate-aged populations in each galaxy: two possible epochs in NGC 185 with log (tyr) ~ 9.0−9.4 and 7.8 − 8.5 (Kang et al. 2005), a range of epochs in NGC 147 with approximately 8.2 ≲ log (tyr) ≲ 8.6 having a peak of log (tyr) = 8.4 (Sohn et al. 2006), a range of epochs in NGC 6822 with approximately 8.0 ≲ log (tyr) ≲ 10.0 having a peak of log (tyr) = 9.0 (Kang et al. 2006). Similarly, Davidge (2005) also inferred the range of ages for M-giant stars in NGC 147, NGC 185, and NGC 205 by comparing the (J − K) color in the color histograms of M-giant stars with Z = 0.008 with the Girardi et al. (2002) isochrones for MKs = −7.4 and ages of log (tyr) = 8.1,9.0, and 9.8. Davidge restricted the brightness range of M-giant stars with −7.6 < MK < −7.2 to avoid sample incompleteness and to span the full range of ages of the stars.
To estimate the range of ages for M-giant stars in NGC 205, we also applied the same technique. Figure 9 shows the histogram distribution of the (J − Ks) for 1,630 M-giant stars with −7.6 < MKs < −7.2 at an interval of 0.05 mag. Arrows are the (J − Ks) colors of the theoretical isochrones of M-giant stars at MKs = −7.4, with Z = 0.008 and no-dust case, for ages of log (tyr) = 9.0 and 9.7 with the adopted distance and reddening of NGC 205. The spread of the color distribution of the M-giant stars indicates that NGC 205 contains M-giant stars spanning a wide range of star formation epochs (i.e., log (tyr) ~ 9.0−9.7), having a peak of log (tyr) = 9.3. Our WIRCam field is approximately 32 times larger than that of Davidge (2005), and we used the new isochrones of Marigo et al. (2008).
 |
Fig. 9 Histogram distribution of (J − Ks) color for 1,630 M-giant stars with −7.6 < MKs < −7.2 per 0.05 mag interval. Arrows indicate the predicted (J − Ks) colors of the isochrones for M-giant stars (Marigo et al. 2008) at MKs = −7.4 with Z = 0.008 and ages of log (tyr) = 9.0 and 9.7. |
4.3. Luminosity functions
Luminosity functions (LFs) for the resolved AGB stars in a galaxy are a useful tool for comparing the evolution models of AGB stars with observations. Moreover, bolometric LF and the mean bolometric magnitude of C stars in a galaxy depend upon the metallicity and star formation history of a galaxy (Groenewegen 1999; Nowotny et al. 2003). Near-infrared observations have an advantage of deriving the LFs of AGB stars in a galaxy because some red bright stars detected on near-infrared images are not always visible in optical images.
 |
Fig. 10 Left: the completeness-corrected LFs in the MKs for the M-giants and C stars. The inner small panel in the lower panel indicates the logarithmic LF of M-giant of NGC 205. The LFs with solid lines show the M-giants and C stars detected in the WIRCam field of NGC 205. Right: the completeness-corrected bolometric LFs for the M-giants and C stars. |
The two diagrams on the left of Fig. 10 show the completeness-corrected LFs in the MKs for the M-giants and C stars detected in the entire observed area of NGC 205. The completeness-corrected logarithmic LF in the MKs of M-giant stars is also shown in the inner small panel in the lower-left panel of Fig. 10. The MKs LF of C stars is unlikely to be a Gaussian distribution, which is consistent with our previous results in NGC 147 and NGC 185. We estimated the logarithmic slope of the MKs LF for the M-giant stars in NGC 205 to be 0.84 ± 0.01, by performing a least-squares fit to the brightness interval of − 8.5 < MKs < − 7.1. Compared to the slopes with our previous studies for nearby dwarf galaxies, this value is comparable with dwarf elliptical galaxies, i.e., 0.83 ± 0.02 for NGC 185 (Kang et al. 2005) and, 0.79 ± 0.02 for NGC 147 (Sohn et al. 2006), but is lower than a dwarf irregular galaxy, i.e, 1.12 ± 0.03 for NGC 6822 (Kang et al. 2006). This result implies that the star formation history for M-giant stars among dwarf elliptical galaxies is likely similar but different from that in the dwarf irregular galaxy. We will check whether the slope in the K band LF of M-giants depends on the morphology of dwarf galaxies in a forthcoming paper.
 |
Fig. 11 Completeness-corrected LFs in the MKs (dot-dashed) and the Mbol (solid) for the C stars in each region. |
Mean absolute and bolometric mangitude of C stars, and the logarithmic slope of MKs LF for C and M-giant stars in NGC 205.
Figure 11 shows the MKs and Mbol LFs for the C stars in each region of NGC 205. We estimated the mean magnitude in the Ks band and the logarithmic slope of the MKs LF for the C stars in each region of NGC 205 (Table 4). For comparison, we also estimated the logarithmic slope of the MKs LF for the M-giant stars in each region, and found that “NE” (0.53) and “NW” (1.45) differ from the value for total M-giants (0.84). It also seems that the slopes of the MKs LF for the C stars in the northern part are slightly steeper than in the southern part. With the result of the higher C/M ratio in the northern part, this suggests that the star formation history is different to places within NGC 205.
Bolometric corrections in the K band, BCK, were estimated separately for the M-giants and C stars in NGC 205 from the empirical relations between BCK and (J − K) for Galactic and LMC AGB stars. For the M-giants, we applied the relations for the Galactic and LMC M-giants given by Bessell & Wood (1984), while for the C stars we applied that for the Galactic C stars given by Costa & Frogel (1996). The right panels of Fig. 10 show the completeness-corrected bolometric LFs of the M-giants and C stars in NGC 205. The bolometric LF for the M-giant stars in NGC 205 extends to Mbol = −6.0 mag, and that of the C stars spans − 5.6 < Mbol < − 3.0. The mean bolometric LF of the C stars in NGC 205 is estimated to be Mbol = −4.24 ± 0.55. This is the equivalent of those of C stars in nearby dwarf galaxies, i.e., Mbol = −4.50 ± 0.42 in NGC 185 (Kang et al. 2005), Mbol = −4.32 ± 0.49 in NGC 147 (Sohn et al. 2006), and Mbol = −4.36 ± 0.54 in NGC 6822 (Kang et al. 2006).
5. Summary
The JHKs images were used to investigate the AGB population in the nearby dwarf elliptical galaxy NGC 205. Our main results are summarized as follows.
-
1.
The CMDs of NGC 205 based on theJHKs photometry show various populations of MS, RGB, AGB, and foreground stars. The AGB populations in the CMDs are dominated by M-giant stars and red C stars.
-
2.
A total of 1,550 C stars were selected from AGB stars in the near-infrared CCD. The mean magnitude and colors of the 1,550 C stars in ~ 24′ × 24′ field of NGC 205 are estimated to be ⟨ Ks ⟩ = 17.08 ± 0.54, ⟨ (J − Ks) ⟩ = 1.85 ± 0.41 and ⟨ (H − Ks) ⟩ = 0.78 ± 0.24. This is equivalent to ⟨ MKs ⟩ = −7.49, ⟨ (J − Ks)0 ⟩ = 1.81, and ⟨ (H − Ks)0 ⟩ = 0.76 at the distance of NGC 205.
-
3.
The C/M ratio of the entire observed WIRCam field is estimated to be 0.15 ± 0.01. The slightly lower C/M ratio (i.e., higher metallicity) in the southern part compared to the northern part could be the result of different star formation history in NGC 205.
-
4.
The (J − Ks) color histogram shows the main peak of M-giant stars and the red tail of C stars. A spread of the color distribution of the M-giant stars indicates a range of star formation epochs log (tyr) ~ 9.0 − 9.7 in NGC 205.
-
5.
The logarithmic slope of the MKs LF for the M-giant stars with − 8.5 < MKs < − 7.1 is estimated to be 0.84 ± 0.01. This value is similar to dwarf elliptical galaxies NGC 147 and NGC 185, but lower than the irregular galaxy NGC 6822.
-
6.
The logarithmic slopes of the MKs LF for the C and M-giant stars are slightly different to places, implying a different star formation history within NGC 205.
-
7.
The bolometric LF for M-giants in NGC 205 extends to Mbol = −6.0 mag, and that for C stars spans − 5.6 < Mbol < − 3.0. The bolometric LF of C stars is probably not a Gaussian distribution, and the mean bolometric magnitude of C stars is estimated to be Mbol = −4.24 ± 0.55, which is comparable with our previous results for the dwarf elliptical galaxies NGC 147 and NGC 185.
Acknowledgments
This research was supported by the Basic Science Research Program through the National Research Foundation of Korea (NRF) funded by the Ministry of Education, Science and Technology (2010-0021867). This work is partially supported by the KASI-Yonsei Joint Research Program (2010 − 2011) for the Frontiers of Astronomy and Space Science funded by the Korea Astronomy and Space Science Institute. M.Y. Jung is grateful for the support provided by the EU FP7 participation support program (2008 − 2011) of the National Research Foundation of Korea.
References
- Albert, L., Demers, S., & Kunkel, W. E. 2000, AJ, 119, 2780 [NASA ADS] [CrossRef] [Google Scholar]
- Asplund, M. 2003, ASP Conf. Ser., 304, 275 [NASA ADS] [Google Scholar]
- Battinelli, P., & Demers, S. 2000, AJ, 120, 1801 [NASA ADS] [CrossRef] [Google Scholar]
- Battinelli, P., & Demers, S. 2004a, A&A, 418, 33 [NASA ADS] [CrossRef] [EDP Sciences] [Google Scholar]
- Battinelli, P., & Demers, S. 2004b, A&A, 417, 479 [NASA ADS] [CrossRef] [EDP Sciences] [Google Scholar]
- Battinelli, P., & Demers, S. 2005, A&A, 434, 657 [NASA ADS] [CrossRef] [EDP Sciences] [Google Scholar]
- Battinelli, P., Demers, S., & Letarte, B. 2003, AJ, 125, 1298 [NASA ADS] [CrossRef] [Google Scholar]
- Battinelli, P., Demers, S., & Mannucci, F. 2007, A&A, 474, 35 [NASA ADS] [CrossRef] [EDP Sciences] [Google Scholar]
- Bessell, M. S., & Wood, P. R. 1984, PASP, 96, 247 [NASA ADS] [CrossRef] [Google Scholar]
- Bica, E., Alloin, D., & Schmidt, A. A. 1990, A&A, 228, 23 [NASA ADS] [Google Scholar]
- Bressan, A., Granato, G. L., & Silva, L. 1998, A&A, 332, 135 [NASA ADS] [Google Scholar]
- Butler, D. J., & Martínez-Delgado, D. 2005, AJ, 129, 2217 [NASA ADS] [CrossRef] [Google Scholar]
- Cappellari, M., Bertola, F., Burstein, D., et al. 1999, ApJ, 515, L17 [NASA ADS] [CrossRef] [Google Scholar]
- Choi, P. I., Guhathakurta, P., & Johnston, K. V. 2002, AJ, 124, 310 [NASA ADS] [CrossRef] [Google Scholar]
- Cioni, M.-R. L. 2009, A&A, 506, 1137 [NASA ADS] [CrossRef] [EDP Sciences] [Google Scholar]
- Cioni, M.-R. L., & Habing, H. J. 2003, A&A, 402, 133 [NASA ADS] [CrossRef] [EDP Sciences] [Google Scholar]
- Cioni, M.-R. L., & Habing, H. J. 2005, A&A, 429, 837 [NASA ADS] [CrossRef] [EDP Sciences] [Google Scholar]
- Cioni, M.-R. L., van der Marel, R. P., Loup, C., & Habing, H. J. 2000, A&A, 359, 601 [NASA ADS] [Google Scholar]
- Cook, K. H., Aaronson, M., & Norris, J. 1986, ApJ, 305, 634 [NASA ADS] [CrossRef] [Google Scholar]
- Costa, E., & Frogel, J. A. 1996, AJ, 112, 2607 [NASA ADS] [CrossRef] [Google Scholar]
- Cowie, L. L., Songaila, A., Hu, E. M., & Cohen, J. G. 1996, AJ, 112, 839 [Google Scholar]
- Cutri, R. M., Skrutskie, M. F., van Dyk, S., et al. 2003, The IRSA 2MASS All-Sky Point Source Catalog, NASA/IPAC Infrared Science Archive. http://irsa.ipac.caltech.edu/applications/Gator/ [Google Scholar]
- Davidge, T. J. 2003, ApJ, 597, 289 [NASA ADS] [CrossRef] [Google Scholar]
- Davidge, T. J. 2005, AJ, 130, 2087 [NASA ADS] [CrossRef] [Google Scholar]
- Demers, S., & Battinelli, P. 2002, AJ, 123, 238 [NASA ADS] [CrossRef] [Google Scholar]
- Demers, S., Battinelli, P., & Letarte, B. 2003, AJ, 125, 3037 [NASA ADS] [CrossRef] [Google Scholar]
- Fich, M., & Hodge, P. 1991, ApJ, 374, L17 [NASA ADS] [CrossRef] [Google Scholar]
- Frogel, J. A., Persson, S. E., & Cohen, J. G. 1980, ApJ, 239, 495 [NASA ADS] [CrossRef] [Google Scholar]
- Geha, M., Guhathakurta, P., Rich, R. M., & Cooper, M. C. 2006, AJ, 131, 332 [NASA ADS] [CrossRef] [Google Scholar]
- Girardi, L., Bertelli, G., Bressan, A., et al. 2002, A&A, 391, 195 [NASA ADS] [CrossRef] [EDP Sciences] [Google Scholar]
- Gonçalves, D. R., Magrini, L., Leisy, P., & Corradi, R. L. M. 2007, MNRAS, 375, 715 [NASA ADS] [CrossRef] [Google Scholar]
- Grebel, E. K. 1999, The Stellar Content of Local Group Galaxies, 192, 17 [NASA ADS] [Google Scholar]
- Grebel, E. K., Gallagher, J. S., III, & Harbeck, D. 2003, AJ, 125, 1926 [NASA ADS] [CrossRef] [Google Scholar]
- Groenewegen, M. A. T. 1999, Asymptotic Giant Branch Stars, 191, 535 [Google Scholar]
- Groenewegen, M. A. T. 2006, A&A, 448, 181 [NASA ADS] [CrossRef] [EDP Sciences] [Google Scholar]
- Haas, M. 1998, A&A, 337, L1 [NASA ADS] [Google Scholar]
- Harbeck, D., Gallagher, J. S., III, & Grebel, E. K. 2004, AJ, 127, 2711 [NASA ADS] [CrossRef] [Google Scholar]
- Howley, K. M., Geha, M., Guhathakurta, P., et al. 2008, ApJ, 683, 722 [NASA ADS] [CrossRef] [Google Scholar]
- Hughes, S. M. G., & Wood, P. R. 1990, AJ, 99, 784 [NASA ADS] [CrossRef] [Google Scholar]
- Ibata, R., Irwin, M., Lewis, G., Ferguson, A. M. N., & Tanvir, N. 2001, Nature, 412, 49 [NASA ADS] [CrossRef] [PubMed] [Google Scholar]
- Iben, I., Jr., & Renzini, A. 1983, ARA&A, 21, 271 [NASA ADS] [CrossRef] [Google Scholar]
- Jones, D. H., Mould, J. R., Watson, A. M., et al. 1996, ApJ, 466, 742 [NASA ADS] [CrossRef] [Google Scholar]
- Kang, A., Sohn, Y.-J., Rhee, J., et al. 2005, A&A, 437, 61 [NASA ADS] [CrossRef] [EDP Sciences] [Google Scholar]
- Kang, A., Sohn, Y.-J., Kim, H.-I., et al. 2006, A&A, 454, 717 [NASA ADS] [CrossRef] [EDP Sciences] [Google Scholar]
- Kerschbaum, F., Nowotny, W., Olofsson, H., & Schwarz, H. E. 2004, A&A, 427, 613 [NASA ADS] [CrossRef] [EDP Sciences] [Google Scholar]
- Letarte, B., Demers, S., Battinelli, P., & Kunkel, W. E. 2002, AJ, 123, 832 [NASA ADS] [CrossRef] [Google Scholar]
- Mannucci, F., Basile, F., Poggianti, B. M., et al. 2001, MNRAS, 326, 745 [NASA ADS] [CrossRef] [Google Scholar]
- Marigo, P. 2002, A&A, 387, 507 [NASA ADS] [CrossRef] [EDP Sciences] [Google Scholar]
- Marigo, P., Girardi, L., & Chiosi, C. 2003, A&A, 403, 225 [NASA ADS] [CrossRef] [EDP Sciences] [Google Scholar]
- Marigo, P., Girardi, L., Bressan, A., et al. 2008, A&A, 482, 883 [NASA ADS] [CrossRef] [EDP Sciences] [Google Scholar]
- Marleau, F. R., Noriega-Crespo, A., Misselt, K. A., et al. 2006, ApJ, 646, 929 [NASA ADS] [CrossRef] [Google Scholar]
- Mateo, M. L. 1998, ARA&A, 36, 435 [NASA ADS] [CrossRef] [Google Scholar]
- McConnachie, A. W., Irwin, M. J., Lewis, G. F., et al. 2004, MNRAS, 351, L94 [NASA ADS] [CrossRef] [Google Scholar]
- McConnachie, A. W., Irwin, M. J., Ferguson, A. M. N., et al. 2005, MNRAS, 356, 979 [NASA ADS] [CrossRef] [Google Scholar]
- McCracken, H. J., Metcalfe, N., Shanks, T., et al. 2000, MNRAS, 311, 707 [NASA ADS] [CrossRef] [Google Scholar]
- Monaco, L., Saviane, I., Perina, S., et al. 2009, A&A, 502, L9 [NASA ADS] [CrossRef] [EDP Sciences] [Google Scholar]
- Mould, J., Kristian, J., & Da Costa, G. S. 1984, ApJ, 278, 575 [NASA ADS] [CrossRef] [Google Scholar]
- Nikolaev, S., & Weinberg, M. D. 2000, ApJ, 542, 804 [NASA ADS] [CrossRef] [Google Scholar]
- Nowotny, W., Kerschbaum, F., Schwarz, H. E., & Olofsson, H. 2001, A&A, 367, 557 [NASA ADS] [CrossRef] [EDP Sciences] [Google Scholar]
- Nowotny, W., Kerschbaum, F., Olofsson, H., & Schwarz, H. E. 2003, A&A, 403, 93 [NASA ADS] [CrossRef] [EDP Sciences] [MathSciNet] [Google Scholar]
- Puget, P., Stadler, E., Doyon, R., et al. 2004, Proc. SPIE, 5492, 978 [Google Scholar]
- Ratnatunga, K. U., & Bahcall, J. N. 1985, ApJS, 59, 63 [NASA ADS] [CrossRef] [Google Scholar]
- Schlegel, D. J., Finkbeiner, D. P., & Davis, M. 1998, ApJ, 500, 525 [NASA ADS] [CrossRef] [Google Scholar]
- Sharina, M. E., Afanasiev, V. L., & Puzia, T. H. 2006, MNRAS, 372, 1259 [NASA ADS] [CrossRef] [Google Scholar]
- Simien, F., & Prugniel, P. 2002, A&A, 384, 371 [NASA ADS] [CrossRef] [EDP Sciences] [Google Scholar]
- Sohn, Y.-J., Kang, A., Rhee, J., et al. 2006, A&A, 445, 69 [NASA ADS] [CrossRef] [EDP Sciences] [Google Scholar]
- Stetson, P. B. 1987, PASP, 99, 191 [NASA ADS] [CrossRef] [Google Scholar]
- Stetson, P. B., & Harris, W. E. 1988, AJ, 96, 909 [NASA ADS] [CrossRef] [Google Scholar]
- Tolstoy, E. 2003, Ap&SS, 284, 579 [NASA ADS] [CrossRef] [Google Scholar]
- Valcheva, A. T., Ivanov, V. D., Ovcharov, E. P., & Nedialkov, P. L. 2007, A&A, 466, 501 [NASA ADS] [CrossRef] [EDP Sciences] [Google Scholar]
- Valenti, E., Ferraro, F. R., & Origlia, L. 2004, MNRAS, 354, 815 [NASA ADS] [CrossRef] [Google Scholar]
- van den Bergh, S. 2000, The galaxies of the Local Group (Cambridge, UK: Cambridge University Press), Cambridge Astrophys. Ser., 35 [Google Scholar]
- van Zee, L., Skillman, E. D., & Haynes, M. P. 2006, ApJ, 637, 269 [NASA ADS] [CrossRef] [Google Scholar]
- Welch, G. A., Sage, L. J., & Mitchell, G. F. 1998, ApJ, 499, 209 [NASA ADS] [CrossRef] [Google Scholar]
- Wood, P. R., Bessell, M. S., & Paltoglou, G. 1985, ApJ, 290, 477 [NASA ADS] [CrossRef] [Google Scholar]
- Young, L. M., & Lo, K. Y. 1997, ApJ, 476, 127 [NASA ADS] [CrossRef] [Google Scholar]
All Tables
Mean absolute and bolometric mangitude of C stars, and the logarithmic slope of MKs LF for C and M-giant stars in NGC 205.
All Figures
|
Fig. 1 Digitized Sky Survey image of NGC 205. The whole field-of-view is 32′ × 32′ with north up and east to the left. The WIRCam field covers a ~24′ × 24′ area in the central area of NGC 205 (thick line). The six regions of ~6′ × 11′ are divided to investigate the spatial dependence of the photometric properties of C stars in NGC 205 (thin line). |
| In the text | |
|
Fig. 2 Left: the results of artificial star experiments on the stacked JHKs images (dashed, dotted, and solid lines) of a ~24′ × 24′ field of the WIRCam observation. Right: the results of the experiments as a function of the projected radius (Rc) from the center of NGC 205. Only stars brighter than Ks = 18.1 mag were considered because we assumed that AGB stars are brighter than Ks = 18.1 mag in Sect. 3.2. The completeness is the number of recovered artificial stars divided by the total number of added stars. ΔM (mag) is the mean difference between the actual input magnitudes and the measured magnitudes by DAOPHOTII/ALLSTARS, and σ (mag) is the standard deviation of the ΔM. |
| In the text | |
|
Fig. 3 (J − Ks,Ks) and (H − Ks,Ks) CMDs for stars detected in JHKs bands of the total WIRCam observed area (only 20% of stars randomly selected in the total sample are shown with gray dots). The isochrones are limited to the maximum mass-loss rate on the TP-AGB with no-dust case. The estimated color and magnitude range of the TRGB (Valenti et al. 2004) at the distance of NGC 205 also are presented with thick slanted lines. Arrows indicate the estimated TRGB magnitude in Ks with Ks = 18.1. The yellow plus symbol denotes C stars selected in RICNTiO photometry (Demers et al. 2003), and the open circles represent 309 C stars cross-identified in JHKs photometry (in this work) and RICNTiO photometry (Demers et al. 2003). |
| In the text | |
|
Fig. 4 Lower: the Ks band luminosity function (LF) of the resolved stars in NGC 205. Black line is the LF for the measured stars, and the gray line is that for the completeness-corrected number of stars. Upper: the second derivatives of the observed LF and the completeness-corrected LF. Vertical dotted lines in each panel indicate the determined magnitudes of the TRGB (i.e., Ks = 18.1 mag). |
| In the text | |
|
Fig. 5 Theoretical isochrone of log (tyr) = 8.2,9.1, and 10.0 with Z = 0.008 (upper) and Z = 0.019 (lower) (Marigo et al. 2008) on the near-infrared (J − Ks,Ks) CMD of NGC 205. The different isochrone colors show different evolutionary states. The green line corresponds to pre-TP-AGB stars, and the blue and orange lines represent M-giant stars and C stars, respectively. The different dust obscuration models are represented by different line types; continuous lines for the no-dust, dot-dashed lines for Bressan et al. (1998), and dashed lines for Groenewegen (2006) (the 0.85 AMC + 0.15 SiC mixture for C stars, and 0.6 silicate + 0.4 AlOx mixture for M-giant stars). The Galactic foreground stars with blue dots and the AGB star (green: M-giants, and red: C stars) dots are divided at (J − Ks) = 0.97. The yellow plus and open circle symbols are the same as those in Fig. 3. |
| In the text | |
|
Fig. 6 Function of age vs. the (J − Ks) color at the appearing C stars on the isochrones, i.e., C/O > 1, for the no-dust case (Marigo et al. 2008). The range of ages is log (tyr) = 8.40 − 9.40 with Z = 0.008 (solid line), and log (tyr) = 8.40 − 9.15 with Z = 0.019 (dot-dashed line). The dotted line represents the adopted color cut of (J − Ks) = 1.43 to separate C stars from M-giant stars. |
| In the text | |
|
Fig. 7 (H − Ks) − (J − Ks) color − color diagram and color histograms of (H − Ks) (upper) and (J − Ks) (right) for selected AGB stars. The dotted lines and arrows represent the color cuts of (J − Ks) = 1.43 and (H − Ks) = 0.47 to separate C stars from M-giants. The green and red dots correspond to M-giants and C stars, respectively. The yellow plus and open circle symbols are the same as those in Figs. 3 and 5. |
| In the text | |
|
Fig. 8 Histogram distributions of (J − Ks) colors for the resolved 11,928 AGB stars of the WIRCam fields (left) and the AGB stars in each region (right). The standard deviation (σJ − Ks) is the 1σ deviation estimated by the Gaussian fitting of the histogram. |
| In the text | |
|
Fig. 9 Histogram distribution of (J − Ks) color for 1,630 M-giant stars with −7.6 < MKs < −7.2 per 0.05 mag interval. Arrows indicate the predicted (J − Ks) colors of the isochrones for M-giant stars (Marigo et al. 2008) at MKs = −7.4 with Z = 0.008 and ages of log (tyr) = 9.0 and 9.7. |
| In the text | |
|
Fig. 10 Left: the completeness-corrected LFs in the MKs for the M-giants and C stars. The inner small panel in the lower panel indicates the logarithmic LF of M-giant of NGC 205. The LFs with solid lines show the M-giants and C stars detected in the WIRCam field of NGC 205. Right: the completeness-corrected bolometric LFs for the M-giants and C stars. |
| In the text | |
|
Fig. 11 Completeness-corrected LFs in the MKs (dot-dashed) and the Mbol (solid) for the C stars in each region. |
| In the text | |
Current usage metrics show cumulative count of Article Views (full-text article views including HTML views, PDF and ePub downloads, according to the available data) and Abstracts Views on Vision4Press platform.
Data correspond to usage on the plateform after 2015. The current usage metrics is available 48-96 hours after online publication and is updated daily on week days.
Initial download of the metrics may take a while.