| Issue |
A&A
Volume 543, July 2012
|
|
|---|---|---|
| Article Number | A101 | |
| Number of page(s) | 23 | |
| Section | Galactic structure, stellar clusters and populations | |
| DOI | https://doi.org/10.1051/0004-6361/201219022 | |
| Published online | 05 July 2012 | |
New members of the massive stellar population in Cygnus⋆,⋆⋆,⋆⋆⋆
1
ESO, Karl-Schwarzschild-Strasse 2, 85748 Garching bei
München Germany
e-mail: This email address is being protected from spambots. You need JavaScript enabled to view it.
2
Astronomisches Rechen-Institut, Zentrum für Astronomie der
Universität Heidelberg, Mönchhofstr
12–14, 69120
Heidelberg,
Germany
e-mail: This email address is being protected from spambots. You need JavaScript enabled to view it.
Received:
12
February
2012
Accepted:
17
April
2012
Abstract
Context. The Cygnus OB2 association and its surroundings display the richest collection of massive stars in our nearby Galactic environment and a wealth of signposts of the interaction between these stars and the interstellar gas.
Aims. We perform a magnitude-limited, homogeneous census of O and early B-type stars with accurate spectral classifications in the blue, in a 6° × 4° region centered on Cygnus OB2 that includes most of the Cygnus X complex, a sizeable fraction of the adjacent Cygnus OB9 association, and a large area of the field surrounding these complexes.
Methods. By using reddening-free indices based on BJHK magnitudes from the USNO-B and 2MASS catalogs, we are able to produce a highly complete, highly uncontaminated sample of O and early B stars, which nearly duplicates any previous census of the region for the same range of spectral types. We provide the spectral types of 60 new O and B stars, as well as a list of an additional 60 candidates pending spectroscopic confirmation. In addition, the UBV imaging of the surroundings of three apparently isolated O stars is used to investigate the possible presence of small clusters of young stars around them.
Results. Early-type stars are consistent with similar distances for Cygnus OB2, OB9, and the field stars surrounding them. We confirm previous findings of an older population in Cygnus OB2 spatially offset from where the stellar density of the association peaks. Some new remarkable objects are identified, including BD+40 4210, a B0 supergiant member of Cygnus OB2 that is among the brightest members of the association sharing some characteristics with luminous blue variable (LBV) candidates, located at a projected distance of 5 pc from another LBV candidate. A new O5If member of Cygnus OB9 is found, as well as several other O stars and B supergiants. On the other hand, while no obvious clustering is found around the apparently isolated O stars, the fields around two of them seem to contain objects with strong ultraviolet excesses, which perhaps indicates that they are accreting, although their nature and possible relationship to the O stars in the field are unclear.
Conclusions. Star formation in Cygnus has been taking place in a sustained manner for well over 10 Myr, with a large-scale trend of proceeding from lower to higher Galactic longitudes. Star formation inside Cygnus OB2 follows this trend, with indications of intense star formation activity having started in the southern (lower galactic latitude) part of the association about 10 Myr ago and probably continuing at present in the north.
Key words: stars: early-type / stars: formation / open clusters and associations: individual: Cygnus OB2 / open clusters and associations: individual: Cygnus OB9 / ISM: individual objects: Cygnus X
Based on observations collected at the Centro Astronómico Hispano-Alemán (CAHA) at Calar Alto, operated jointly by the Max-Planck Institut für Astronomie and the Instituto de Astrofísica de Andalucía (CSIC); and with the IAC80 telescope operated on the island of Tenerife by the Instituto de Astrofísica de Canarias in the Spanish Observatorio del Teide.
Tables 1–7 are available at http://www.aanda.org
Tables 1–7 are also available at the CDS via anonymous ftp to cdsarc.u-strasbg.fr (130.79.128.5) or via http://cdsarc.u-strasbg.fr/viz-bin/qcat?J/A+A/543/A101
© ESO, 2012
1. Introduction
The massive-star forming complexes in Cygnus (Reipurth & Schneider 2008) are among the most well-suited regions of our Galactic neighborhood to study the processes leading to the formation of large stellar complexes along spiral arms (Elmegreen 2004) and the interaction between massive stars and the interstellar medium. The region is extraordinarily rich in signposts of massive star formation, both recent and ongoing (e.g. Odenwald & Schwartz 1993). It contains several OB associations (Humphreys 1978; Garmany & Stencel 1992; Mel’nik & Efremov 1995; Knödlseder et al. 2002), including the very rich Cygnus OB2 association, and abundant molecular and ionized gas mainly in the large Cygnus X complex (Wendker et al. 1991; Schneider et al. 2006). It has also been found that related to these complexes are large-scale structures such as HI bubbles and the still enigmatic Cygnus superbubble (Cash et al. 1980; Bochkarev & Sitnik 1985; Uyaniker et al. 2001) that may have been produced by the combined energetic activity of the massive stars in the region (Comerón et al. 1998). The region is also a unique high-energy laboratory providing direct insight into the nucleosynthesis processes taking place in massive stars (Knödlseder et al. 2002; Martin et al. 2010).
The Cygnus star-forming complexes extend over a wide interval in Galactic longitude (roughly 70° < l < 95°) and most probably also in distance. Some prominent complexes in this region of the sky, such as the Cygnus OB7 association and the North America and Pelican nebulae, are most likely less than 1 kpc from the Sun (Garmany & Stencel 1992; Laugalys & Straizys 2002; Comerón & Pasquali 2005), while the kinematics of other objects in the same general direction clearly associate them with the more distant Perseus arm in the background. However, the bulk of massive-star formation in Cygnus appears to lie at roughly 1.4–1.5 kpc from the Sun (Knödlseder 2002; Rygl et al. 2011). At these distances, the complex is dominated by the very rich and compact association Cygnus OB2 (Torres-Dodgen 1991; Knödlseder 2000, 2003; Comerón et al. 2002), other neighboring associations such as Cygnus OB9, and the massive-star forming complex Cygnus X, all testifying to the vigorous, extended star-forming activity occurring at present in this area (Schneider et al. 2006; Reipurth & Schneider 2008). However, evidence has been found in recent years of massive-star formation extending into the past and perhaps predating the birth of Cygnus OB2. In her spectroscopy study of new candidate O and B stars in Cygnus OB2 identified by Comerón et al. (2002), Hanson (2003) found a large number of B stars of luminosity classes I to III, which she interpreted as an older, more spatially distributed population. A similar result was found by Comerón et al. (2008), who showed that the population of evolved stars with massive progenitors (M > 10 M⊙) extends beyond the boundaries of Cygnus OB2 and most likely beyond a 2° radius around the association (see also Drew et al. 2008; Wright et al. 2010). These evolved B stars represent a previous generation of massive stars that sculpted the local interstellar medium, out of which the present generation formed, and were perhaps responsible for the formation of large-scale structures such as the Cygnus superbubble.
In this paper, we study the massive star content of a large area extending 6° × 4° in Galactic longitude and latitude, respectively, centered on Cygnus OB2. It includes much of the neighboring association Cygnus OB9, as well as the Cygnus X complex and several other star-forming regions. The massive stellar component of some of these regions has been the subject of previous studies, most notably Cygnus OB2 itself (Massey & Thompson 1991; Hanson 2003; Comerón et al. 2002, 2008; Kiminki et al. 2007; Negueruela et al. 2008), and the open cluster NGC 6910, which possibly belongs to Cygnus OB9 (Delgado & Alfaro 2000). However, no homogeneous study with a uniform selection criterion for the identification of massive stars over the entire area has been carried out in the recent past. In the present study, we use the combined visible and near-infrared photometry provided by the United States Naval Observatory-B (USNO-B) and Two-Micron All-Sky Survey (2MASS) catalogs to produce a large list of candidate O and B stars in the area. Many of them have already been identified and spectroscopically classified in previous studies, but we increase the census by adding 60 new O and B stars, for which spectral types are provided. We also produce a list of additional candidate O and B stars for future spectroscopic classification that, if confirmed, and together with the new stars already classified in the present work, will double the census of O and B stars in this region of Cygnus. The results allow us to explore systematic trends in age and to produce a more complete assessment of the massive stellar content of the region. Some of the newly identified stars are found to have O types but they do not seem to belong to any of the previously known clusters or associations. We present here UBV imaging designed to detect unknown star clusters or aggregates in the vicinity of four of them.
2. Target selection
The power of near-infrared (NIR) observations in revealing the true structure, content, and extension of Cygnus OB2 and its surroundings was dramatically demonstrated by Knödlseder (2000), who used star counts in the 2MASS Point Source Catalog (Skrutskie et al. 2006) to suggest that Cygnus OB2 is comparable in both richness and extent to a young globular cluster. Comerón et al. (2002) used 2MASS-based color–color criteria to select a sample of candidate O and B stars for which they obtained H- and K-band low-resolution spectroscopy. These NIR spectra confirmed that most of the photometrically selected objects were indeed early-type stars, some of them displaying emission lines typical of evolved stages (Morris et al. 1996). Accurate spectral types in the visible of the least obscured early-type candidates of Comerón et al. (2002) were obtained by Hanson (2003), who confirmed them to be O and B stars with types B2 or earlier. The success rate of the near-infrared color criterion was further exploited by Comerón et al. (2008) to identify additional early-type stars in the surroundings of Cygnus OB2. The spectroscopic follow-up of that work shows that about half of the sample selected based on 2MASS colors is actually composed of late-type stars, including long-period variables and carbon stars.
The combination of CCD photometry in the visible from the USNO-B catalog with near-infrared photometry from 2MASS in the NOMAD catalog (Zacharias et al. 2004) and more recently in the UCAC3 catalog (Zacharias et al. 2010) allowed us to refine our earlier photometric selection criteria. The inclusion of a data point at visible wavelengths in order to more tightly constrain the intrinsic spectral energy distribution of stars proves to be very helpful in distinguishing between reddened early-type stars and intrinsically red late-type stars. After experimenting with reddening-free indices based on the B, R, I, J, H, and K bands, we find that the index cuts ![Mathematical equation: \begin{eqnarray} Q_{BJK} &=& 0.196 (B-J) - 0.981 (J-K) - 0.098 > 0 \\[2mm] Q_{JHK} &=& 0.447 (J-H) - 0.894 (H-K) - 0.089 < 0 \end{eqnarray}](/articles/aa/full_html/2012/07/aa19022-12/aa19022-12-eq14.png) are most efficient in discarding late-type contaminants when applied to the spectroscopically observed samples of Comerón et al. (2002, 2008). The coefficients multiplying the various colors are empirically determined by plotting the stars in the region on the (B − J), (J − K) and the (J − H), (H − K) diagrams respectively, thus tracing the direction of the extinction vector. Most of the values obtained are within 10% of those derived using the Rieke & Lebofsky (1985) extinction law for the diffuse interstellar medium. The exception is the coefficient multiplying the (B − J) color, which is 22% higher than the corresponding Rieke & Rieke (1985) value. This may be expected because of the greater tendency of shorter wavelengths to depart from the standard extinction law. The value that we empirically determine is actually close to that obtained from the Cardelli et al. (1989) extinction law for a total-to-selective extinction ratio RV = 4.0, which is in-between the RV values characteristic of the diffuse interstellar medium and of dense interstellar medium in star-forming regions. Evidence of a high value of RV in the direction of Cygnus was presented by Terranegra et al. (1994), which agrees with our finding.
are most efficient in discarding late-type contaminants when applied to the spectroscopically observed samples of Comerón et al. (2002, 2008). The coefficients multiplying the various colors are empirically determined by plotting the stars in the region on the (B − J), (J − K) and the (J − H), (H − K) diagrams respectively, thus tracing the direction of the extinction vector. Most of the values obtained are within 10% of those derived using the Rieke & Lebofsky (1985) extinction law for the diffuse interstellar medium. The exception is the coefficient multiplying the (B − J) color, which is 22% higher than the corresponding Rieke & Rieke (1985) value. This may be expected because of the greater tendency of shorter wavelengths to depart from the standard extinction law. The value that we empirically determine is actually close to that obtained from the Cardelli et al. (1989) extinction law for a total-to-selective extinction ratio RV = 4.0, which is in-between the RV values characteristic of the diffuse interstellar medium and of dense interstellar medium in star-forming regions. Evidence of a high value of RV in the direction of Cygnus was presented by Terranegra et al. (1994), which agrees with our finding.
We thus used the BJHK photometry tabulated in the NOMAD catalog1 to obtain a large sample of candidate O and B stars in the 6° × 4° area limited in Galactic coordinates by 77°5 < l < 83°5, −1°2 < b < 2°8. We set a near-infrared limiting magnitude of KS = 9.0 to reduce the number of early-type stars background to the Cygnus complex. The limit corresponds to MK ≃ −2.3 at the estimated distance of Cygnus OB2, assuming a foreground extinction of AV ≃ 5 as typically found among the stars of that association (e.g. Massey & Thompson 1991; see also Sect. 4). Furthermore, to produce a sample that can be spectroscopically confirmed in the B band with a 2m-class telescope and a reasonable investment of observing time, we retained only stars with B < 16. The combination of the KS and B magnitude cuts with the intrinsic (B − K) colors of O and B stars implies that our selection criteria are sensitive to any main-sequence stars earlier than B1 and obscured by AV < 6.7 mag, as well as to stars brighter in K and even more obscured. We note that the selection criterion QBJK > 0 also discriminates against objects having substantial K-band excess, as commonly found among B[e] stars (Kastner et al. 2010).
A literature search reveals that many of the stars in our sample have already been spectroscopically classified by previous surveys, as our selection criteria recover most of the known O and B stars in Cygnus OB2 and Cygnus OB9. However, about half of the sample is composed of stars not previously recognized as early-type, or by stars whose early-type nature had only been roughly established by low-dispersion objective prism spectroscopy. In a small number of cases, published spectral types or those determined by us show that the stars are actually later than B, showing that the new selection criterion is not entirely free from contamination. Nevertheless, its derived success rate of ~80% (defined as the ratio of the spectroscopically confirmed O and B stars to candidates selected by means of the photometric criterion) proves it to be very efficient for our purposes.
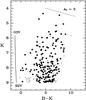 |
Fig. 1 Color–magnitude diagram of stars selected using the criteria given by Eqs. (1) and (2). Stars retrieved by those criteria but with confirmed later spectral types (see Sect. 3.1) have been excluded. Filled circles are O and B-type stars spectroscopically confirmed, either by previous studies or by the present one, and dots are O and B-type candidates lacking spectroscopic confirmation. The solid line marks the position of the unreddened upper main sequence based on the “observational” Teff scale of Martins et al. (2006) shifted to a distance modulus DM = 10.8. The dotted line represents the displacement caused in the diagram by an extinction of AV = 5 mag, using the reddening law of Cardelli et al. (1989) with total-to-selective extinction ratio RV = 3.1. The sharp cuts in the distribution of points are due to our magnitude limits KS < 9, B < 16. |
The B − KS,KS diagram of the stars selected by our criteria (1) and (2) is presented in Fig. 1. Their distribution shows that most of them have magnitudes and colors characteristic of moderately reddened O and early B stars at the distances commonly estimated for the OB associations in the area. We note, however, the presence of stars with very bright KS magnitudes, having colors well within the range of those of fainter stars in the region. Spectral classifications are available for almost all of them, showing that they are actual O and B stars rather than foreground later-type stars contaminating the sample. Furthermore, that our QBJK criterion excludes stars with strong infrared excesses as noted above indicates that these stars have very high intrinsic luminosities, as confirmed by their spectroscopic classification as blue supergiants (Sect. 3.1).
While most of the stars in the region lie within the boundaries of Cygnus OB2 or Cygnus OB9, some are rather distant from these associations as well as from any other known cluster. We thus selected three of these apparently isolated, spectroscopically confirmed O stars for follow-up imaging observations, in order to search for possible still unknown clusters in their surroundings and thus check whether they are truly isolated.
3. Observations
3.1. Spectroscopy and spectral classification
Spectroscopy in the visible of more than half (see Sect. 4) of the new O and B candidate stars that were photometrically selected was obtained with the 2.2 m telescope of the Calar Alto observatory using CAFOS, the facility visible-light imager and low-resolution spectrograph, during three observing runs in July 2006, July–August 2008, and July–August 2010, the last two being conducted in service mode by the observatory. The grism used covered the range shortwards of λ = 6350 Å at a resolution of λ/Δλ = 1000 with a  slit. Exposure times were decided based on the B magnitude, and ranged from 10 min for the brightest sources to 180 min for the faintest. For integration times longer than 30 min, the exposures were divided into blocks of 30 min. Spectra of three lamps of HgCd, He, and Rb were taken between subsequent exposures for wavelength calibration, to minimize the effects of instrument flexure. The frames containing the raw spectra were corrected for the effects of both bias and flat field, and the spectra were subsequently extracted from each one of them. The individual wavelength-calibrated spectra were coadded after identification and removal of cosmic ray hits. The coadded spectra were finally normalized to the interpolated continuum.
The extracted spectra were classified using as a reference the extensive atlas of early spectral types of Walborn & Kirkpatrick (1990), which is well-suited to our work given its spectral resolution similar to that of our observations and its dense grid of O and B spectral types with different luminosity classes. We used the spectral subtype and luminosity class indicators noted in the atlas, which were summarized in Comerón et al. (2008) for the range of interest in this work. All the early-type stars in our sample are significantly obscured and display prominent interstellar absorption features, particularly the diffuse interstellar bands. Approximate uncertainties in the spectral classifications were estimated to be one luminosity class and half a spectral subtype by comparing the independent classification of each spectrum by each of the authors. Some of the stars observed by us also have spectral types published by other authors, particularly by Kiminki et al. (2007) and Negueruela et al. (2008), who carried out spectroscopic observations in the visible of photometrically selected stars from the studies of Massey & Thompson (1991) and Comerón et al. (2002), respectively. A comparison of our spectral classifications with those obtained by these authors generally confirms our estimate of the uncertainty, as discussed in Sect. 4.1.
3.2. Imaging
The UBV images of fields measuring  around three apparently isolated O stars newly classified by us were obtained with the CAMELOT camera at the IAC80 telescope at the Teide Observatory, on the nights of 1 to 4 September 2010. Four dithered observations of each field were performed in B and V with individual exposure times of 15 min and 8 min, respectively. For the U band, six observations of 30 min each were obtained. The images were bias-subtracted, flat-fielded and average-combined using standard IRAF2 tasks. Point-spread function photometry was then performed using dedicated IRAF scripts making use of the DAOPHOT ALLSTAR task (Stetson 1987). Photometric calibration was carried out by obtaining a sequence of short exposures in a given filter of each of the four fields, with an observation of the open cluster NGC 6910 at the beginning and the end of the sequence. In this way, a set of local photometric standards was established for each field. The procedure was then repeated for the other two filters. The observations were carried out near the time of the meridian transit of the region. Photometric zeropoints and color terms were computed using the NGC 6910 stellar photometry published by Delgado & Alfaro (2000). We also made use of the average extinction coefficients publicly available for the Teide Observatory. The short photometric calibration exposures were also used to derive the magnitudes of the brightest stars in each field, which were saturated in the long exposures. The 5σ detection limits of our observations are U = 22.1 mag, B = 23.4 mag and V = 22.4 mag.
4. Results
The application of the selection criteria described in Sect. 2 to the sample of NOMAD stars within the area and B, K magnitude limits described there has provided us with a list of 260 photometrically selected stars. Of those, 119 are confirmed O- and B-type stars with spectral classifications available in the literature (Sect. 4.1). Of the remaining 141, we could confirm 60 as new O or early B stars. Another 20 stars selected by the criteria turn out to have A or later types, either already known from previous studies or revealed by our new spectroscopic observations. Finally, 61 photometrically selected stars remain unobserved spectroscopically and their possible early types are thus unconfirmed.
4.1. Known members
Most of the 119 of the O and B stars recovered by our selection criteria that had been previously classified as such in the region belong to Cygnus OB2. These stars are listed in Table 1, together with their published spectral types and the reference to the one that we adopt, since more than one spectroscopic classification is frequently found for the same star in the literature. Some of the stars listed in Table 1 were also observed by us, in most cases because they were included in the observing programs of other research teams while we were collecting data for the present study. The overlap of Table 1 with our own observations provides a useful benchmark for our own spectral classifications. The subset of stars of Table 1 for which we also obtained spectral types is listed in Table 2, where the comparison with the published spectral types confirms the estimated accuracy of our spectral classification as given in Sect. 3.1.
We compared our list of known members fulfilling (1) and (2) with that of Cygnus OB2 stars brighter than B = 16 and KS = 9 spectroscopically classified as earlier than B2 by Massey & Thompson (1991). The comparison with a sample of confirmed O and early B stars independently selected should provide an accurate estimate of the degree of efficiency of our criterion, that is, the fraction of the actual population of O and B stars that are recovered by it. Of the 64 Cygnus OB2 stars that Massey & Thompson classify as earlier than B2, we found that 51 are brighter than our thresholds in B and K. Our selection criterion recovers 41 of those, leading us to estimate an efficiency of approximately 80% in selecting the O and B stars actually present in the region within the established magnitude limits3. The stars classified by Massey & Thompson (1991) as B2 or earlier that do not fulfill our selection criterion are listed in Table 6.
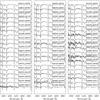 |
Fig. 2 Continuum-normalized spectra of all the stars listed in Table 3. For clarity, only the spectral region used for classification is shown. |
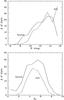 |
Fig. 3 Top: histogram of the B magnitudes of the known stars in the area selected by our criterion (solid line) and those newly found in this work (dashed line). The latter include both spectroscopically confirmed stars, and those photometrically selected but for which spectroscopy is not yet available. Bottom: histogram of derived extinctions toward the spectroscopically classified stars in the area, both previously known and newly identified in this work. |
4.2. New O- and B-type stars
More than half of the candidate O and B stars identified by our selection criteria either have not been recognized as such in previous work, or have only rough spectral classifications published. We obtained classification quality spectra for 60 of them, listed in Table 3. Their spectra are displayed in Fig. 2. Table 4 list the remaining O and B candidates selected based on their BJHKS photometry for which we could not obtain photometry in the time allocated in the various observing runs. Given the high confirmation rate obtained for the spectroscopically confirmed stars, it is to be expected that approximately 80% of these stars also have O or B types.
The distributions in B magnitude of the known and newly identified O and B stars, including those pending spectroscopic confirmation among the latter, is presented in Fig. 3. The distributions are similar and show that the new members are slightly fainter, but insufficiently so to explain why they have been missed by previous surveys. Likewise, the distributions of derived visual extinction toward known members and spectroscopically classified new O and B stars are also shown in Fig. 3, showing that the new members are insignificantly more obscured on average than the known members.
Figure 4 shows the spatial distributions of the previously known O and B stars in the region together with the new, spectroscopically confirmed stars and the photometrically selected candidates for which no spectral classification is yet available. The majority of the newly confirmed members are located outside the region occupied by the brightest stars of Cygnus OB2, where most searches have been concentrated thus far. We do find new members of Cygnus OB2, as discussed in Sect. 5.1, but most of them are in a region adjacent to that containing the largest number of its members. We also identify new members of Cygnus OB9, and many new O and B stars outside these two associations. It is thus apparent from Figs. 3 and 4 that the additions to the O and B census of the region provided by our work come from our having included in our survey, regions that had been either neglected by previous searches, or explored with far less detail than the most crowded regions of Cygnus OB2.
Our selection criteria identified 20 stars with types later than B based on previous spectral classifications, new spectral classifications obtained in this work, or existing photometry in other systems. These stars are listed in Table 5, where the variety of reasons that may contribute to their erroneous selection as candidate O or B stars can be appreciated. Their numbers relative to the stars listed in Tables 1 and 3 leads us to estimate a success rate of 80% of our criteria in the selection of true O and B stars.
4.3. Ages and initial masses
We used the 2MASS (J − KS) color and the intrinsic colors of both O stars from Martins & Plez (2006) and B stars from Tokunaga (2000), to estimate the foreground extinction toward each of the spectroscopically classified stars from Tables 1 and 3, using the extinction law of Cardelli et al. (1989). Temperatures were in turn assigned using the “observational” temperature scale of Martins et al. (2006) and the Teff versus spectral type calibration of Tokunaga (2000). The procedure used is the same as that described in more detail in Comerón et al. (2008). Class V temperatures and colors were adopted in the cases for which no luminosity class could be determined. Given the typical estimated uncertainties of 0.5 subtypes in the spectral classification and 2 classes in the luminosity class, and that the uncertainty in the spectral type versus temperature calibration is on the order of the difference between the “observational” and the “theoretical” temperature scales of Martins et al. (2005), we estimate the uncertainty in the temperature to be Δlog Teff ≃ 0.04 dex. We adopt 0.5 mag as the uncertainty in the dereddened V magnitude, V0, to jointly account for the effects of possible binarity and the error introduced during the dereddening procedure by the scatter in the intrinsic color, uncertainties in the spectral classification, and possible deviations of the actual extinction law from the adopted one (e.g. Terranegra et al. 1994).
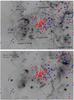 |
Fig. 4 Two views of the interstellar medium in the surveyed field, with the main structures in the region marked. The top panel presents the view in the MSX band A (6.8–10.8 μm), while the bottom one presents the Canadian Galactic plane survey (CGPS; Taylor et al. 2003) radio continuum emission at 21 cm. The symbols mark the stars photometrically selected in the current work after removal of those whose spectra do not confirm their O or B spectral type. Red circles are previously known O and B stars with classifications available in the literature; dark blue squares are stars newly found in the current study and spectroscopically confirmed as having O or B types; and light blue triangles are photometrically selected candidate O and B stars without available spectroscopy. The field is 6° × 4°, Galactic latitude increasing toward the top and Galactic longitude toward the left. |
Following the derivation of Teff and V0 in this way, we estimated initial mass and age of each star using the evolutionary tracks of Lejeune & Schaerer (2001). The chosen set of isochrones was computed for solar metallicity, as appropriate for a nearby recently formed population, and assumed enhanced mass loss (Meynet et al. 1994), as this prescription had been shown to most closely reproduce the low luminosity of some WR stars, as well as the surface chemical composition of WC and WO stars and the ratio of the number of blue to red supergiants in the star clusters of the Magellanic Clouds. As a starting point, we adopted for all the stars a common distance modulus of DM = 10.8 following the extensive discussion of Hanson (2003) about the distance to Cygnus OB2, and the accurate trigonometric derivations produced by Rygl et al. (2011) for sources in the contiguous Cygnus X complex. We later discuss this assumption in the light of our results.
Initial masses and ages were assigned by measuring the distance of each star, expressed in units of the respective uncertainties in Teff and MV given above, to the mesh-points in the available models. The results are presented in Table 7. To estimate the accuracy of the derived initial mass and age, we computed for each star two Gaussian distributions centered at the derived MV and Teff values respectively, and with a variance set equal to the estimated uncertainty in those quantities. By randomly varying MV and Teff in consistency with the aforementioned variance, we produced best fits to the isochrones in a similar way to that outlined above. In this way, we were able to construct for each star the distributions of best-fit ages and initial masses defined by the derived MV and Teff and their respective uncertainties. We first removed the outliers from the distributions using a sigma-clipping (3σ) procedure, and later computed their standard deviations, which we then assumed to be the 1-σ errors in the best-fit age and initial mass. Using this procedure, we estimate the uncertainty in the best-fit age to be about 20%, while that in the best-fit initial mass is ~10% for initial masses below 30 M⊙, and ~20% for higher initial masses.
5. Discussion
Figure 4 presents two views of the interstellar medium tracing the major structures in the region centered on Cygnus OB2, and covering the area where we searched for candidate O and B stars. The stars listed in Tables 1 to 4 are also superimposed. The top panel displays a map obtained with the Midcourse Space Experiment (MSX) satellite (Price et al. 2001) in the A (6.8–10.8 μm) band, mainly tracing thermal emission from heated dust. The bottom panel shows the view in the 21 cm radio continuum, dominated by ionized gas emission and some non-thermal sources in the region. The main structures of the interstellar medium are indicated on the images. Figure 5 shows our delimitation of the boundaries of Cygnus OB2 and OB9 and the location of all the spectroscopically classified stars. This delimitation is similar to that of Garmany & Stencel (1992) and is obviously to some extent subjective. This caveat must be kept in mind in the discussion that follows, particularly when referring to stars that are near the adopted boundaries of the associations. Stars are plotted with different symbols according to their derived ages: asterisks, four-pointed stars, and three-pointed stars indicate young (< 4 Myr), intermediate (4–10 Myr), and old (>10 Myr) stars, respectively.
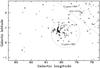 |
Fig. 5 Location of stars in the young (asterisks), intermediate (four-pointed stars), and old (three-pointed stars) age groups defined in the text in the surveyed area. The approximate boundaries of the associations are marked. |
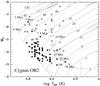 |
Fig. 6 Temperature-absolute magnitude diagram of stars in Cygnus OB2 selected by our criteria, assuming for the absolute magnitude a distance modulus DM = 10.8. Isochrones (dotted lines) and evolutionary tracks of stars of various masses (dashed lines) from Lejeune & Schaerer (2001) are plotted. Filled circles are stars of luminosities IV and V, open squares are giant stars of luminosity classes II and III, and open triangles and stars of luminosity class I. Typical uncertainties in both absolute magnitude and temperature as described in the text are represented in the lower right. |
5.1. Cygnus OB2
The concentration of O and B stars that form the Cygnus OB2 association clearly stands out in Figs. 4 and 5. While this concentration closely matches the stellar overdensity contours derived by Knödlseder (2000) from 2MASS star counts, previously known members cluster toward higher Galactic longitudes. They define the sub-area within Cygnus OB2 that has been most studied by previous surveys (Massey & Thompson 1991) and where the very early-type, most luminous members, which led to the initial identification of Cygnus OB2 (Münch & Morgan 1953; Schulte 1956), are located together with X-ray emitting stars (Albacete Colombo et al. 2007; Wright et al. 2009). The extension of Cygnus OB2 beyond this sub-area was confirmed by the identification and classification of new early-type members by Comerón et al. (2002, 2008) and the identification of large numbers of candidate A-type stars through narrow-band imaging by Drew et al. (2008), who also noted that their distribution is offset toward lower Galactic longitudes than the main body of the association.
A comparison of the positions of stars in the Teff vs. MV diagram with the isochrones and evolutionary tracks used for our analysis, as shown in Fig. 6, supports the adopted distance modulus DM = 10.8, with only two luminosity class V stars lying slightly below the ZAMS. With very few exceptions, stars belonging to different luminosity classes are reasonably well-separated in absolute magnitude. The most discordant case appears to be J20314965+4128265, classified as O9III by Kiminki et al. (2007), although a previous classification as O9.5V by Schulte (1958) agrees more closely with its position in the Teff vs. MV diagram. The comparison with the isochrones indicates a considerable age spread among the members, many of which are older than 3–4 Myr. The spatial location of the stars in the different age groups shown in Fig. 5 shows that the older stars, which compose most of our sample of newly identified members, tend to be located at low Galactic longitudes. This agrees with the results of Drew et al. (2008), who assigned a representative age of 7 Myr to their sample of A-type candidate members of the association using the same distance modulus that we adopt here. It is also consistent with Hanson (2003) who showed that the evolved early B-type stars in the sample of Comerón et al. (2002) tend to be displaced from region preferentially occupied by the early O stars.
Several attempts have been made to derive the initial mass function of Cygnus OB2, assisted by the abundance of very high-mass stars that comprehensively cover its uppermost end. For a power-law mass function of the form dξ(M) = M−Γ dlog M, where dξ(M) is the number of stars of mass M per logarithmic mass interval, Massey & Thompson (1991) found Γ = −1.0 ± 0.1, which was corrected to Γ = −0.9 ± 0.2 in the reanalysis of the data by Massey et al. (1995). The region considered is the one containing the highest concentration of stars, which, as we have seen, is also the youngest one, thus less biased by evolutionary effects. A steeper slope of the mass function over a wide range of masses, Γ = −1.09 ± 0.13, was found by Wright et al. (2010) from their sample of X-ray emitting stars. Similarly, Knödlseder et al. (2002) derived Γ = −1.1 ± 0.3 based on a rather heterogeneous compilation of data, again based on the youngest parts of the association. Using a different approach based on 2MASS star counts and infrared colors, Knödlseder (2000) derive Γ = −1.6 ± 0.1 assuming main sequence absolute magnitudes for O and B stars. Since the latter study also includes the older stars of the association, it is quite possible that the steeper slope with respect to the other works cited above is due to the disappearance of the most massive members that initially populated Cygnus OB2.
Trying to derive the initial mass function at the high-mass end over the whole Cygnus OB2 association from our sample is fraught with uncertainties despite our homogeneous member candidate selection criteria. Besides the significant uncertainties in the model fits possibly caused by binarity, rotation, angle of view, and the models themselves, stellar evolution has progressively depopulated the upper main sequence in the older parts of the association. Infrared surveys have revealed early-type members of Cygnus OB2 obscured by extinctions of up to a few tens of magnitudes in the visible (Comerón et al. 2002), implying that much of its stellar content remains undetected when selection criteria involving visible bands are involved. This in turn implies that there is a bias when magnitude-limited samples are considered, as the brighter stars remain detectable at higher extinction, and thus over larger volumes. When age-limited samples are considered, the slow evolution of the least massive stars on or near the main sequence makes their assignment to the different age groups difficult. Finally, both assigned masses and ages depend significantly on the precise distance adopted for the association.
In view of these difficulties, we attempted to produce a rough estimate of the initial mass function slope by using an extinction-limited sample defined by stars with AV < 6, initial masses in the range 43 M⊙ > M > 17 M⊙, and age < 4 Myr. The lower mass limit corresponds to the onset of incompleteness of the sample for extinctions within the range defined above, and the upper mass limit by the evolution of the most massive stars beyond the temperature range within which our color-based selection criteria can select them. The adopted limits in extinction and age thus represent a compromise, yielding a sample of 20 stars over a relatively wide mass range. Extending the mass range would require restricting the sample to younger ages in order to avoid evolutionary effects, whereas allowing for larger extinctions would require the use of a higher value of the low-mass cutoff to avoid sample incompleteness. We then divided the selected mass range into two bins, a “higher mass” bin with Nhigh stars having Mi > 25 M⊙ and a “lower mass” one with Nlow stars, and estimated Γ from 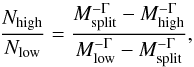 where Mlow and Mhigh are respectively the low- and high-mass ends of the mass range under consideration. Taking into account the considerable uncertainties in Nhigh and Nlow (caused by stars that lie near the boundary between both bins, as well as stars that lie near the limits of the mass and age ranges considered), we obtained Γ = −2.1±1.6. The very large uncertainty thus renders the shape of the upper end of the initial mass function in Cygnus OB2 virtually unconstrained by our results, and illustrates the difficulties encountered in trying to determine the shape of the initial mass function in an association where significant evolution has already taken place at the high-mass end, and where interstellar extinction restricts samples selected based on visible fluxes to a small fraction of the total census.
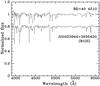 |
Fig. 7 Full normalized spectrum of BD + 40 4210 obtained with CAFOS, showing the broad emission features near 5600 Å and 5800 Å. |
5.1.1. BD+40 4210
Among the new Cygnus OB2 candidate members located at low Galactic latitudes, BD+40 4210 is distinctive because of its brightness, which at KS = 4.466 makes it one of the brightest members of the association. We derived an absolute magnitude MV = −7.66 and a mass of 54 M⊙ for this star. We tentatively assigned to it a B1III:e spectral type, noting that its Balmer lines are generally much shallower than those of other B1III stars, as shown in Fig. 7. Furthermore, we observed broad emission features near 5600 Å and 5800 Å, which we tentatively ascribed to OV (λ = 5592 Å) and CIV (λ = 5805 Å). These are strong features in the spectra of some Wolf-Rayet (WR) stars of the WC and WO types (e.g Vreux et al. 1983; Crowther et al. 1998), although their intensity in WR stars, especially for the CIV emission, is much stronger than that observed in the spectrum of BD+40 4210. We do not observe any other obvious emission lines in the wavelength range covered by our observations, which unfortunately excludes Hα. A visible light curve of BD+40 4120 obtained over a period of 186 days at an effective wavelength close to that of the R band is available from the Northern Sky Variability Survey (Woźniak et al. 2004). It is characterized by an amplitude slightly below 0.1 mag and a possible period of 100 days.
The estimated temperature and luminosity of BD+40 4210 most likely place it within the S Dor instability trip and close to its high-temperature edge (Smith et al. 2004), where hot luminous blue variables (LBVs; see e.g. Humphreys & Davidson 1994; Smith et al. 2010) are located. A search for circumstellar nebulosity in archive Spitzer images of the region around BD+40 4210, hinting at past LBV-like eruptive episodes, yields negative results. However, it is remarkable that BD+40 4210 lies only 11 4 (4.8 pc projected distance at 1450 pc) from the LBV candidate G79.29+0.46, which is surrounded by a ring nebula well-studied at infrared and radio wavelenghts (Wendker et al. 1991; Umana et al. 2011, and references therein). A clustering of emission-line objects was reported by Vink et al. (2008) near the same area. The central source of G79.29+0.46 with KS = 4.33 is even brighter than BD+40 4210 and much more reddened if its near-infrared emission is entirely photospheric. It is also detected at visible wavelengths, but its classification is impossible based on the available spectroscopy (Higgs et al. 1994). The presence of two such very massive stars within a short distance, projected onto a region generally populated by post-main sequence less-massive stars, shows that star formation in this part of Cygnus OB2 has been taking place sustainedly for a long time, as discussed in Sect. 5.1.
5.2. Cygnus OB9
Cygnus OB9 spans an area of roughly 4° × 3° in Galactic longitude and latitude (Garmany & Stencel 1992). Our survey covers only the high Galactic longitude region beside Cygnus OB2. At low Galactic longitudes, Cygnus OB9 merges with Cygnus OB1, possibly forming a single vast conglomerate (Mel’nik & Efremov 1995; Schneider et al. 2007). The Teff vs. MV diagram of the stars in Cygnus OB9 is plotted in Fig. 8 for the same distance modulus DM = 10.8 of Cygnus OB2. This indicates that Cygnus OB9 is dominated by both intermediate – age and old stars if it is indeed located at that distance. The presence of B stars with luminosity classes I to III and the upper envelope of the distribution of luminosity class IV-V in the Teff vs. MV diagram presented in Fig. 8 are consistent with those estimates of the distance and the age. However, a significantly closer distance, perhaps as close as the value of 1.0 kpc (DM = 10.0) derived by Garmany & Stencel (1992) is not entirely ruled out by our results. It would imply a younger age for most of members of Cygnus OB9, and would make a physical relationship with the complex out of which Cygnus OB2 formed implausible, on the basis of the large distance between them along the line of sight. However, such a short distance would also imply that the four bona-fide supergiant members of Cygnus OB9 (the already known B0.5Ib HD 228929 and B0.5Ia HD 228882, plus the newly found B1Ia J20214410+4012529 and O5If J20223777+4140292 discussed below) are significantly less luminous than supergiants with similar spectral types in Cygnus OB2. We thus favor a common distance to both Cygnus OB2 and OB9. On the other hand, the location of the class V stars identified in Cygnus OB9 is hardly consistent with the value of DM = 11.2 derived by Delgado & Alfaro (2000) for the open cluster NGC 6910, which is normally assumed to be a member of Cygnus OB9. The discrepancy between the distance estimates to NGC 6910 and the surrounding Cygnus OB9 was already noted by Garmany & Stencel (1992), and reinforced by later studies (e.g. Kołaczkowski et al. 2004), including the results presented here. The possibility that NGC 6910 may actually be an unrelated cluster in the background of Cygnus OB9 would explain this discrepancy.
The existence of a wide range of distances among the early-type stars selected by our criteria, particularly the existence of early-type stars beyond the main body of Cygnus OB2 and possibly beyond NGC 6910, is supported by our finding of giants and supergiants with unreddened magnitudes in the same range as class V stars of similar temperature, a feature that is virtually absent from the Teff vs. MV diagram of Cygnus OB2. The supergiant spectral classification is doubtful for J20243872+3930301, which we tentatively classify as B0I: (owing to the noisy spectrum available), but more robust for J20215160+3959496 (B1Ib) and J20190610+4037004 (O9.7Iab). We believe that the latter two stars are likely to be in background of Cygnus OB9, and might even belong to the more distant Perseus arm. Other giants with faint derived absolute magnitudes may also be in the background.
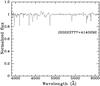 |
Fig. 9 Full normalized spectrum of J20223777+4140292 obtained with CAFOS, showing the emission features of NIII (4640 Å) and HeII (4686 Å). |
As noted above, we find among the new members of the association a previously unnoticed O5If star, J20223777+ 4140292, which may be the most massive member of Cygnus OB9 at present, with an estimated initial mass of 40 M⊙. Emission lines of NIII near 4640 Å and HeII at 4686 Å are prominent in its spectrum shown in Fig. 9. This star, together with other mid O-type stars previously known, shows that massive star formation occurred throughout the association until few million years ago.
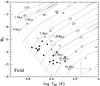 |
Fig. 10 Same as Fig. 6, now for the stars outside the boundaries assigned to either Cygnus OB2 or Cygnus OB9. |
5.3. The field population
Some of the stars previously known in the region, as well as some newly discovered ones, are found outside the boundaries assigned to either both Cygnus OB2 and OB9 or any other aggregate. The distinction between this field population and members of the associations is sometimes difficult given the lack of definite boundaries for the latter. Furthermore, at least one star in the field population, BD+43 3654, is most likely to be a runaway star recently ejected from Cygnus OB2, as shown by Comerón & Pasquali (2007), rather than a true field member. However, the number of identified stars well outside the approximate boundaries of the OB associations argues that there has been sustained massive-star formation activity in the field, and proper motions listed in the UCAC3 catalog do not provide evidence of a significant population of runaway stars.
The overall distribution of stars that we assign to the field population in the Teff vs. MV diagram, shown in Fig. 10, agrees with a distance modulus that is also consistent with those of the two associations. The location of the sequence defined by luminosity class V stars occupies a similar position, and stars of luminosity classes I to III appear generally above the sequence. It is thus likely that the field population is physically associated with the rest of the past and recent star forming activity in the region, as we discuss in Sect. 5.4.
Most of the field stars are B-type and belong to the intermediate and old age groups defined above, but there are also some O stars that indicate that there has been episodic massive star formation within the past 3–4 Myr. These stars bridge the gap between the older population and the current numerous star-forming regions in the Cygnus X complex, which is largely located outside the boundaries of the associations.
It is unclear whether the most luminous star in Fig. 10, the already known B0.5Iae star HD 194839, belongs to the field population, as it lies in the narrow region between Cygnus OB2 and OB9 and may also be a member of either association. Its kinematics makes it unlikely that HD 194839 is a runaway star (Tetzlaff et al. 2011), and Spitzer mid-infrared imaging of its surroundings shows no evidence of a bow shock.
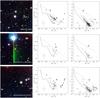 |
Fig. 11 Images, color–color, and color–magnitude diagrams of the fields around the late O-type stars BD+42 3760, J20325571+4307583, and J20462826+4223417. The O stars are the brightest stars slightly left of the center of the images. North is at the top and east to the left in all the images, and the field of view measures approximately |
5.3.1. Isolated O stars in the field
The intermediate-age and old stars in the field may be the most massive remnants of former associations or loosely bound clusters that have already dissolved, or the result of the early dynamical evolution of the existing associations. Nevertheless, the presence of a few young massive stars that are clearly independent of the known associations confirms that recent massive star formation has taken place in the field. Because of their location and youth, these stars are good test cases to investigate whether massive stars can form in isolation (Zinnecker & Yorke 2007). Some compelling cases of likely isolated formation of massive stars have been reported in the Large (Chu & Gruendl 2008) and Small Magellanic Clouds (Selier et al. 2011), and the fraction of actual isolated O stars in the Milky Way was assessed by de Wit et al. (2004, 2005) to be between 5% and 10%.
The proximity of the Cygnus region to the Sun provides some advantages over studies of more distant stars in that meaningful kinematical information is available. It is also possible to check for the presence of accompanying clusters of low-mass stars that may show that the existence of the apparently isolated massive stars is actually a consequence of the random sampling of the initial mass function in the formation of relatively low-mass clusters, as proposed by Parker & Goodwin (2007).
We chose to observe the stars BD+42 3760 (O8.5V), J20325571+4307583 (O9.5V), and J20462826+4223417 (O9V), which are located more than one degree outside the adopted boundary of Cygnus OB2 (that is, more than 25 pc of projected distance). We performed UBV imaging of the field surrounding each of them as described in Sect. 3.2. The field of view of the instrument corresponds to a projected area of 4.2 × 4.2 pc2 at the adopted distance of Cygnus OB2, which is adequate to cover the whole extent of a Pleiades-like cluster. UBV photometry provides a traditional way of identifying early-type stars through the reddening-free index Q = (U − B) − 0.72(B − V), which assumes an interstellar reddening law characterized by a total-to-selective extinction ratio RV = AV/E(B − V) = 3.1. Using the main sequence colors from Drilling & Landolt (2000), early-type candidate stars in each field (spectral type approximately B1V and earlier) were identified as those having Q < −0.7.
Figure 11 shows images of each field, together with the color–color and color–magnitude diagrams. The central O star of each field is marked in both diagrams, as well as the candidate early-type stars identified by means of their Q indices. Although stars with Q < −0.7 are identified in all fields, none of them show evidence of a physical clustering of early-type stars around the targeted O star, as in all cases the early-type candidates are too faint to be early-type stars at the same distance. Indeed, stars with negative values above the threshold identifying early-type stars are always below the line indicating the location of B0V stars reddened by different amounts, which probably indicates that they are in the background.
An intriguing feature of the (U − B),(B − V) diagrams of the stellar population around BD+42 3760 and J20462826+4223417 shown in Fig. 11 is the appearance in both cases of a group of stars with very red (B − V) colors and unusually negative Q indices, even larger in absolute value than expected if they were very early-type, highly reddened stars. Despite the photometric uncertainties, their unusual brightness in the U band compared to their (B − V) color is well-established by their very detection in U. Their faintness combined with their very red (B − V) colors would place them below the U-band detection limits if they had normal photospheric colors, and that they are detected in U despite their faint and very red B, V magnitudes indicates that they have unusually high ultraviolet fluxes. The Q indices continue to be exceptionally negative even if the coefficient multiplying the (B − V) term in the expression giving Q above is changed to any other reasonable value.
Rather than being background early-type candidates, the combination of red (B − V) and blue (U − B) colors of these stars with highly negative Q indices leads us to propose that these may be instead intermediate- or low-mass stars undergoing the intense accretion that can cause strong ultraviolet excess. If this interpretation were correct, then the color–color and color–magnitude diagrams may imply that there is a population of lower-mass stars in the fields of BD+42 3760 and J20462826+4223417. This might lend support to the hypothesis of Parker & Goodwin (2007) that apparently isolated O stars are actually the most massive members of clusters containing a normal population of lower-mass stars, in which the presence of the very massive star and the apparent absence of other O and B stars is due to the random sampling of the initial mass function. Unfortunately, a lack of spectroscopic data does not allow us to confirm the nature of these objects for the time being. Furthermore, their spatial distribution shows no obvious concentration toward the O stars, thus casting doubts on the possible physical association with them.
5.4. An overall picture of star formation history in the region
The distributions of stellar ages in the areas of Cygnus OB2, OB9, and the field are shown in Fig. 12. Reconstructing the star formation rate from those distributions would require corrections for stellar evolution and the variation in the depths reached in the different regions owing to the varying amount of extinction. Nevertheless, some general features can be appreciated from the figure. Some degree of massive-star formation has been maintained in the whole region for at least the past few tens of Myr. The star formation activity in Cygnus OB2 started to increase dramatically around 10 Myr ago, peaking at about 3 Myr ago with the formation of the dense aggregate of very hot and luminous stars that nowadays dominates the northern part of the association.
The use of the B magnitude in our criteria to select O and B stars introduces a bias in our sample against the youngest members of the region, which may be expected to be located in areas where large amounts of embedded molecular gas and dust are still present. The reality of this bias is confirmed by a comparison of our results with those of Comerón et al. (2008), where the selection of stars is based on near-infrared colors alone. The results presented in that work show a noticeable abundance of highly obscured early-type stars to the north of Cygnus OB2 (higher Galactic longitudes), coincident with the densest concentrations of molecular gas of Cygnus X North (Schneider et al. 2006), where massive-star forming regions such as DR17, DR21, DR23, and W75N are located. Almost no stars with low or moderate levels of extinction are detected in the present work in that area.
The distribution of ages within and among massive-star forming sites suggest an overall, grand-scale picture in which massive-star forming activity has been widespread in the region for tens of Myr. In the past (>10 Myr ago), most of the massive-star formation took place in the south (lower Galactic longitudes), producing the Cygnus OB9 association. Some 10 Myr ago, the main episode of star formation activity started moving north, to the southern part of Cygnus OB2, and progressed northward until its culmination about 3 Myr ago with the formation of the major concentration of massive stars in the north of Cygnus OB2. The location of embedded massive stars outside the boundaries of Cygnus OB2 reported by Comerón et al. (2008) shows that star formation continues to proceed northward at the present time in Cygnus X north, which will perhaps lead to the emergence of a new association in a few Myr from now on, as also suggested in that work. This general picture shows more complexity on smaller scales, with the existence of stars within the boundaries of Cygnus OB9 that are younger than the bulk of the stars in the southern part of Cygnus OB2, and the existence of very massive young stars such as BD+40 4210 in that same area of Cygnus OB2, or the coexistence of young O-type stars with evolved B stars in the field.
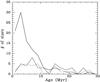 |
Fig. 12 Histogram of derived ages of stars within the boundaries of Cygnus OB2 (solid line), Cygnus OB9 (dashed line), and in the field (dotted line). The histograms include all the O and B stars selected by our photometric criteria for which a spectroscopic classification is available, either from the literature or the present work. |
6. Conclusions
We have presented an improved census of moderately obscured O and early B stars in the wide area surrounding Cygnus OB2 that substantially increases the number of known OB stars in this region. Our selection criteria, based on the BJHK magnitudes published in the USNO-B and 2MASS all-sky catalogs, produce a homogeneous sample limited by design to B < 16 and K < 9. Based on the confirmation rate that we obtain from the spectral classification of 117 stars, we estimate that approximately 80% of the objects selected as early-type candidates are indeed O or early B stars. Similarly, by comparing with samples obtained by Massey & Thompson (1991) using UBV colors, we estimate that our selection criteria recover approximately 80% of the stars in the O-B2 spectral range within the magnitude limits quoted above. This is still far from providing a complete catalog of the massive stellar content of the region, as much of it remains inaccessible to visible wavelengths owing to heavy obscuration. However, it enables studies of the large-scale star formation trends over the region and the discovery of new objects of particular interest.
Our main findings can be summarized as follows:
-
A distance modulus of DM = 10.8 (Hanson 2003), inferred from recent trigonometric distance determinations to sources in the region (Rygl et al. 2011), is in good agreement with the position in the temperature-absolute magnitude diagram of the spectroscopically classified stars in the region. No obvious differences in distance appear between O and B stars in Cygnus OB2, Cygnus OB9, and the field. At a given temperature, main sequence, giants, and supergiants tend to appear clearly separated in the temperature-absolute magnitude diagram built by assuming a common distance modulus.
-
Using individual stellar ages derived from the comparison with theoretical evolutionary tracks, the entire region is found to display a mixture of ages ranging from less than 3 Myr to over 10 Myr, thus indicating a long sustained rate of star formation.
-
The presence of evolved stars in Cygnus OB2 is used to infer that a vigorous massive-star formation activity started about 10 Myr ago and culminated 3 Myr ago. The association extends beyond the area occupied by the youngest and hottest members of Cygnus OB2 where most studies have been thus far concentrated. The southern part (lower Galactic longitude) of the association is clearly older, although it does contain some very massive objects formed in the past few millions of years. The extension of the association and the older age of the southern part confirms previous findings (e.g. Drew et al. 2008; Wright et al. 2010), mostly based on less massive stellar members of the association.
-
BD+40 4210, a new member of Cygnus OB2 that we have classified as B1III:e, is a remarkable member of this association. It has an estimated mass of 54 M⊙ and is one of the most luminous members of the association. Its location in the temperature-luminosity diagram places it in the S Dor instability strip occupied by luminous blue variable (LBV) candidates (Smith et al. 2004). Apart from moderately intense, broad emission features near 5600 Å and 5800 Å and some likely variability at the 0.1 mag level, there is no evidence of past outbursts that would qualify BD+40 4210 as a LBV candidate. Most remarkably, BD+40 4210 is only 11′ away from G79.29+0.46, a bona-fide LBV candidate at the center of a compact ring nebula.
-
If it lies at the same distance as Cygnus OB2, Cygnus OB9 is clearly older, although it does contain some members younger than 4 Myr, particularly the O5If star J20223777+ 4140292, which, with an estimated mass of 40 M⊙ may be the most massive member of the association at present. A distance modulus of DM = 11.2, similar to that found by Delgado & Alfaro (2000) for the cluster NGC 6910, is inconsistent with our results, thus casting doubts on the actual membership of NGC 6910 in Cygnus OB9.
-
We have discovered many new O and B stars in the field, which are not obviously related to larger structures. The position of most of these stars in the temperature-magnitude diagram is consistent with a common distance to both Cygnus OB2 and OB9. A variety of ages is found among these stars, which include some unevolved late O-type stars.
-
The UBV imaging of the fields around three apparently isolated O stars does not show any evidence of clustering around them. However, the fields around two of these stars seem to contain objects with strong ultraviolet excesses, which perhaps indicates that there has been intense accretion onto young intermediate- or low-mass stars. The nature of these objects and their possible relationship with the O stars remain unclear at present.
-
An overall pattern of star formation propagation is suggested by the distribution of ages in the region under study. According to this picture, massive-star formation over the past 10–20 Myr has proceeded from lower to higher Galactic longitudes, starting from Cygnus OB9, continuing in the southern part of Cygnus OB2, and increasing in its northern part about 3 Myr ago, when the compact aggregate of hot, luminous stars that dominate the current appearance of Cygnus OB2 in the visible was formed. Intense massive-star formation activity is observed to be taking place at present in the Cygnus X north complex, located further north from Cygnus OB2, suggesting that the northward propagation of star formation in the region continues. However, the more detailed view of the star formation history made possible by the availability of individual age determinations appears to follow a more intricate scenario, in which recent star formation has also taken place in the areas dominated by an older component.
Online material
Known, spectroscopically classified O and B stars in the region.
Stars with previous classification reobserved by us.
New O and B stars.
Other candidate O and B stars without spectral classification.
Later-type stars.
Physical parameters of spectroscopically classified O and B stars, assuming DM = 10.8.
The more recent UCAC3 catalog (Zacharias et al. 2010) also provides this merged information. However, UCAC3 not having yet been published at the time when we carried out our sample selection, we preferred to keep the reference to the NOMAD catalog for consistency.
IRAF is distributed by NOAO, which is operated by the Association of Universities for Research in Astronomy, Inc., under contract to the National Science Foundation.
Note that this is unrelated to the success rate previously quoted in Sect. 3, which also turns out to be around 80% and gives an indication of the reliability of the selection criteria in producing uncontaminated samples of O and B stars.
Acknowledgments
We are pleased to thank the staff at the Centro Astronómico Hispano-Alemán on Calar Alto for the execution of part of the observations presented here in service mode, and for their support during our visitor observing run. We also acknowledge the excellent support provided by the staff at the Observatorio del Teide during our observing run at the IAC80 telescope. We also thank Dr. Nicola Schneider for her useful remarks on an earlier version of the manuscript, and the anonymous referee for constructive comments that helped improve the paper. This research has made use of the SIMBAD database, operated at CDS, Strasbourg, France. It also has made use of data products from the Two Micron All Sky Survey, which is a joint project of the University of Massachusetts and the Infrared Processing and Analysis Center/California Institute of Technology, funded by the National Aeronautics and Space Administration and the National Science Foundation; and of the NOMAD Catalogue produced by the United States Naval Observatory.
References
- Albacete Colombo, J. F., Flaccomio, E., Micela, G., et al. 2007, A&A, 464, 211 [NASA ADS] [CrossRef] [EDP Sciences] [Google Scholar]
- Bochkarev, N. G., & Sitnik, T. G. 1985, Ap&SS, 108, 237 [NASA ADS] [CrossRef] [Google Scholar]
- Cardelli, J. A., Clayton, G. C., & Mathis, J. S. 1989, ApJ, 345, 245 [NASA ADS] [CrossRef] [Google Scholar]
- Cash, W., Charles, P., Bowyer, S., et al. 1980, ApJ, 238, L71 [NASA ADS] [CrossRef] [Google Scholar]
- Cameron, D., & Nassau, J. J. 1956, ApJ, 124, 346 [NASA ADS] [CrossRef] [Google Scholar]
- Chu, Y.-H., & Gruendl, R. 2008, ASP Conf. Ser., 387, 415 [NASA ADS] [Google Scholar]
- Comerón, F., & Pasquali, A. 2005, A&A, 430, 541 [NASA ADS] [CrossRef] [EDP Sciences] [Google Scholar]
- Comerón, F., & Pasquali, A. 2007, A&A, 467, L23 [NASA ADS] [CrossRef] [EDP Sciences] [Google Scholar]
- Comerón, F., & Torra, J. 2001, A&A, 375, 539 [NASA ADS] [CrossRef] [EDP Sciences] [Google Scholar]
- Comerón, F., Torra, J., & Gómez, A. E. 1998, A&A, 330, 975 [NASA ADS] [Google Scholar]
- Comerón, F., Pasquali, A., Rodighiero, G., et al. 2002, A&A, 389, 874 [NASA ADS] [CrossRef] [EDP Sciences] [Google Scholar]
- Comerón, F., Pasquali, A., Figueras, F., & Torra, J. 2008, A&A, 486, 453 [NASA ADS] [CrossRef] [EDP Sciences] [Google Scholar]
- Crowther, P. A., De Marco, O., & Barlow, M. J. 1998, MNRAS, 296, 367 [Google Scholar]
- Delgado, A. J., & Alfaro, E. J. 2000, AJ, 119, 1848 [NASA ADS] [CrossRef] [Google Scholar]
- de Wit, W. J., Testi, L., Palla, F., Vanzi, L., & Zinnecker, H. 2004, A&A, 425, 937 [NASA ADS] [CrossRef] [EDP Sciences] [Google Scholar]
- de Wit, W. J., Testi, L., Palla, F., & Zinnecker, H. 2005, A&A, 437, 247 [NASA ADS] [CrossRef] [EDP Sciences] [Google Scholar]
- Douglass, G. C., Mason, B. D., Rafferty, T. J., Holdenried, R. E., & Germain, M. E. 2000, AJ, 119, 3071 [NASA ADS] [CrossRef] [Google Scholar]
- Drew, J. E., Greimel, R., Irwin, M. J., & Sale, S. E. 2008, MNRAS, 387, 08 [NASA ADS] [Google Scholar]
- Drilling, J. S., & Landolt, A. U. 2000, in Allen’s Astrophysical Quantities, ed. A. N.Cox (New York: AIP Press) [Google Scholar]
- Elmegreen, B. G. 2004, in The many scales in the Universe – JENAM 2004 Astrophysics Reviews, ed. J. C. del Toro Iniesta, et al. (Dordrecht: Kluwer Acad. Publ.) [Google Scholar]
- Garmany, C. D., & Stencel, R. E. 1992, A&AS, 94, 211 [NASA ADS] [Google Scholar]
- Guetter, H. H. 1968, PASP, 80, 197 [NASA ADS] [CrossRef] [Google Scholar]
- Hanson, M. M. 2003, ApJ, 597, 957 [NASA ADS] [CrossRef] [Google Scholar]
- Higgs, L. A., Wendker, H. J., & Landecker, T. L. 1994, A&A, 291, 295 [NASA ADS] [Google Scholar]
- Hiltner, W. A. 1956, ApJS, 2, 389 [NASA ADS] [CrossRef] [Google Scholar]
- Hoag, A. A., & Applequist, N. L. 1965, ApJS, 12, 215 [NASA ADS] [CrossRef] [Google Scholar]
- Humphreys, R. M. 1978, ApJS, 38, 309 [NASA ADS] [CrossRef] [EDP Sciences] [Google Scholar]
- Humphreys, R. M., & Davidson, K. 1994, PASP, 106, 1025 [NASA ADS] [CrossRef] [Google Scholar]
- Kastner, J. H., Buchanan, C., Sahai, R., Forrest, W. J., & Sargent, B. A. 2010, AJ, 139, 1993 [NASA ADS] [CrossRef] [Google Scholar]
- Kenyon, S. J., & Hartmann, L. 1995, ApJS, 101, 117 [NASA ADS] [CrossRef] [Google Scholar]
- Kiminki, D. C., Kobulnicky, H. A., Kinemuchi, K., et al. 2007, ApJ, 664, 1102 [NASA ADS] [CrossRef] [Google Scholar]
- Kiminki, D. C., Kobulnicky, H. A., Gilbert, I., Bird, S., & Chunev, G. 2009, AJ, 137, 4608 [NASA ADS] [CrossRef] [Google Scholar]
- Klagyivik, P., & Szabados, L. 2009, A&A, 504, 959 [NASA ADS] [CrossRef] [EDP Sciences] [Google Scholar]
- Knödlseder, J. 2000, A&A, 360, 539 [NASA ADS] [Google Scholar]
- Knödlseder, J. 2003, in A Massive Star Odyssey: From Main Sequence to Supernova, ed. K. van der Hucht, A. Herrero, & C. Esteban (San Francisco: ASP), IAU Symp., 212 [Google Scholar]
- Knödlseder, J., Cerviño, M., Le Duigou, J.-M., et al. 2002, A&A, 390, 945 [NASA ADS] [CrossRef] [EDP Sciences] [Google Scholar]
- Kobulnicki, H. A., Gilbert, I. J., & Kiminki, D. C. 2010, ApJ, 710, 549 [NASA ADS] [CrossRef] [Google Scholar]
- Kołaczkowski, Z., Pigulski, A., Kopacki, G., & Michalska, G. 2004, Acta Astron., 54, 33 [NASA ADS] [Google Scholar]
- Kraemer, K. E., Hora, J. L., Egan, M. P., et al. 2010, AJ, 139, 2319 [NASA ADS] [CrossRef] [Google Scholar]
- Laugalys, V., & Strayzis, V. 2002, Baltic Astron., 11, 205 [Google Scholar]
- Lejeune, T., & Schaerer, D. 2001, A&A, 366, 53 [Google Scholar]
- Martin, P., Knödlseder, J., Meynet, G., & Diehl, R. 2010, A&A, 511, A86 [NASA ADS] [CrossRef] [EDP Sciences] [Google Scholar]
- Martins, F., & Plez, B. 2006, A&A, 457, 637 [NASA ADS] [CrossRef] [EDP Sciences] [Google Scholar]
- Martins, F., Schaerer, D., & Hillier, D. J. 2005, A&A, 436, 1049 [NASA ADS] [CrossRef] [EDP Sciences] [Google Scholar]
- Massey, P., & Thompson, A. B. 1991, AJ, 101, 1408 [NASA ADS] [CrossRef] [Google Scholar]
- Massey, P., Johnson, K. E., & Degioia-Eastwood, K. 1995, ApJ, 454, 151 [NASA ADS] [CrossRef] [Google Scholar]
- Mel’nik, A. M., & Efremov, Y. N. 1995, Astron. Lett., 21, 10 [NASA ADS] [Google Scholar]
- Meynet, G., Maeder, A., Schaller, G., Schaerer, D., & Charbonnel, C. 1994, A&AS, 103, 97 [NASA ADS] [Google Scholar]
- Morgan, W. W., Code, A. D., & Whitford, A. E. 1955, ApJS, 2, 41 [NASA ADS] [CrossRef] [Google Scholar]
- Morris, P. W., Eenens, P. R. J., Hanson, M. M., Conti, P. S., & Blum, R. D. 1996, ApJ, 470, 597 [NASA ADS] [CrossRef] [Google Scholar]
- Münch, L., & Morgan, W. W. 1953, ApJ, 118, 161 [NASA ADS] [CrossRef] [Google Scholar]
- Negueruela, I., Marco, A., Herrero, A., & Clark, J. S. 2008, A&A, 487, 575 [NASA ADS] [CrossRef] [EDP Sciences] [Google Scholar]
- Odenwald, S. F., & Schwartz, P. R. 1993, ApJ, 405, 706 [NASA ADS] [CrossRef] [Google Scholar]
- Parker, R. J., & Goodwin, S. P. 2007, MNRAS, 380, 1271 [NASA ADS] [CrossRef] [Google Scholar]
- Petrie, R. M., Crampton, D., Leir, A., & Jounger, S. 1973, Publ. Dominion Astroph. Obs., 14, 151 [NASA ADS] [Google Scholar]
- Pettersen, B. R., Tsvetkov, M. K., Hawley, S. L., Coleman, L. A., & Amirkhanian, A. S. 1988, Astrofizika, 29, 67 [NASA ADS] [Google Scholar]
- Price, S. D., Egan, M. P., Carey, S. J., Mizuno, D. R., & Kuchar, T. A. 2001, AJ, 121, 2819 [NASA ADS] [CrossRef] [Google Scholar]
- Reipurth, B., & Schneider, N. 2008, in Handbook of Star Formation Regions, ed. B. Reipurth, ASP Monograph (San Francisco: ASP) [Google Scholar]
- Rygl, K. L. J., Brunthaler, A., Sanna, A., et al. 2012, A&A, 539, A79 [NASA ADS] [CrossRef] [EDP Sciences] [Google Scholar]
- Rieke, G. H., & Lebofsky, M. J. 1985, ApJ, 288, 618 [NASA ADS] [CrossRef] [Google Scholar]
- Sato, K., & Kuji, S. 1990, A&AS, 85, 1069 [NASA ADS] [Google Scholar]
- Schneider, N., Bontemps, S., Simon, R., et al. 2006, A&A, 458, 855 [NASA ADS] [CrossRef] [EDP Sciences] [Google Scholar]
- Schneider, N., Simon, R., Bontemps, S., Comerón, F., & Motte, F. 2007, A&A, 474, 873 [NASA ADS] [CrossRef] [EDP Sciences] [Google Scholar]
- Schulte, D. H. 1956, ApJ, 124, 530 [NASA ADS] [CrossRef] [Google Scholar]
- Schulte, D. H. 1958, ApJ, 128, 41 [NASA ADS] [CrossRef] [Google Scholar]
- Selier, R., Heydari-Malayeri, M., & Gouliermis, D. A. 2011, A&A, 529, A40 [NASA ADS] [CrossRef] [EDP Sciences] [Google Scholar]
- Skrutskie, M. F., Cutri, R., Stiening, R., et al. 2006, AJ, 131, 1163 [NASA ADS] [CrossRef] [Google Scholar]
- Smith, N., Vink, J. S., & de Koter, A. 2004, ApJ, 615, 475 [NASA ADS] [CrossRef] [Google Scholar]
- Smith, N., Povich, M. S., Whitney, B. A., et al. 2010, MNRAS, 406, 952 [NASA ADS] [Google Scholar]
- Stankov, A., & Handler, G. 2005, ApJS, 158, 193 [NASA ADS] [CrossRef] [Google Scholar]
- Stetson, P. B. 1987, PASP, 99, 191 [NASA ADS] [CrossRef] [Google Scholar]
- Taylor, A. R., Gibson, S. J., Peracaula, M., et al. 2003, AJ, 125, 3145 [NASA ADS] [CrossRef] [Google Scholar]
- Terranegra, L., Chavaria-K, C., Diaz, S., & González Patiño, D. 1994, A&AS, 104, 557 [NASA ADS] [Google Scholar]
- Tetzlaff, N., Neuhäuser, R., & Hohle, M. M. 2011, MNRAS, 410, 190 [NASA ADS] [CrossRef] [Google Scholar]
- Tokunaga, A. T. 2000, in Allen’s Astrophysical Quantities, ed A. N. Cox (New York: AIP Press) [Google Scholar]
- Torres-Dodgen, A. V., Carroll, M., & Tapia, M. 1991, MNRAS, 249, 1 [NASA ADS] [CrossRef] [Google Scholar]
- Umana, G., Buemi, C. S., Trigilio, C., et al. 2011, ApJ, 739, L11 [NASA ADS] [CrossRef] [Google Scholar]
- Uyaniker, B., Fürst, E., Reich, W., Aschenbach, B., & Wielebinski, R. 2001, A&A, 371, 675 [NASA ADS] [CrossRef] [EDP Sciences] [Google Scholar]
- Vijapurkar, J., & Drilling, J. S. 1993, ApJS, 89, 293 [NASA ADS] [CrossRef] [Google Scholar]
- Vink, J. S., Drew, J. E., Steeghs, D., et al. 2008, MNRAS, 387, 308 [NASA ADS] [CrossRef] [Google Scholar]
- Vogt, S. S. 1973, AJ, 78, 389 [NASA ADS] [CrossRef] [Google Scholar]
- Vreux, J. M., Dennefeld, M., & Andrillat, Y. 1983, A&AS, 54, 437 [NASA ADS] [Google Scholar]
- Walborn, N. R., & Fitzpatrick, E. L. 1990, PASP, 102, 1094 [NASA ADS] [Google Scholar]
- Walker, G. A. H., & Hodge, S. M. 1968, PASP, 80, 290 [NASA ADS] [CrossRef] [Google Scholar]
- Wendker, H. J., Higgs, L. A., & Landecker, T. L. 1991, A&A, 241, 551 [NASA ADS] [Google Scholar]
- Woźniak, P. R., Vestrand, W. T., Akerlof, C. W., et al. 2004, AJ, 127, 2436 [NASA ADS] [CrossRef] [Google Scholar]
- Wright, N. J., & Drake, J. J. 2009, ApJS, 184, 84 [NASA ADS] [CrossRef] [Google Scholar]
- Wright, N. J., Drake, J. J., Drew, J. E., & Vink, J. S. 2010, ApJ, 713, 871 [NASA ADS] [CrossRef] [Google Scholar]
- Zacharias, N., Monet, D. G., Levine, S. E., et al. 2004, A&AS, 205, 4815 [Google Scholar]
- Zacharias, N., Finch, C., Girard, T., et al. 2010, AJ, 139, 2184 [NASA ADS] [CrossRef] [Google Scholar]
- Zinnecker, H., & Yorke, H. W. 2007, ARA&A, 45, 481 [NASA ADS] [CrossRef] [Google Scholar]
All Tables
Physical parameters of spectroscopically classified O and B stars, assuming DM = 10.8.
All Figures
|
Fig. 1 Color–magnitude diagram of stars selected using the criteria given by Eqs. (1) and (2). Stars retrieved by those criteria but with confirmed later spectral types (see Sect. 3.1) have been excluded. Filled circles are O and B-type stars spectroscopically confirmed, either by previous studies or by the present one, and dots are O and B-type candidates lacking spectroscopic confirmation. The solid line marks the position of the unreddened upper main sequence based on the “observational” Teff scale of Martins et al. (2006) shifted to a distance modulus DM = 10.8. The dotted line represents the displacement caused in the diagram by an extinction of AV = 5 mag, using the reddening law of Cardelli et al. (1989) with total-to-selective extinction ratio RV = 3.1. The sharp cuts in the distribution of points are due to our magnitude limits KS < 9, B < 16. |
| In the text | |
|
Fig. 2 Continuum-normalized spectra of all the stars listed in Table 3. For clarity, only the spectral region used for classification is shown. |
| In the text | |
|
Fig. 3 Top: histogram of the B magnitudes of the known stars in the area selected by our criterion (solid line) and those newly found in this work (dashed line). The latter include both spectroscopically confirmed stars, and those photometrically selected but for which spectroscopy is not yet available. Bottom: histogram of derived extinctions toward the spectroscopically classified stars in the area, both previously known and newly identified in this work. |
| In the text | |
|
Fig. 4 Two views of the interstellar medium in the surveyed field, with the main structures in the region marked. The top panel presents the view in the MSX band A (6.8–10.8 μm), while the bottom one presents the Canadian Galactic plane survey (CGPS; Taylor et al. 2003) radio continuum emission at 21 cm. The symbols mark the stars photometrically selected in the current work after removal of those whose spectra do not confirm their O or B spectral type. Red circles are previously known O and B stars with classifications available in the literature; dark blue squares are stars newly found in the current study and spectroscopically confirmed as having O or B types; and light blue triangles are photometrically selected candidate O and B stars without available spectroscopy. The field is 6° × 4°, Galactic latitude increasing toward the top and Galactic longitude toward the left. |
| In the text | |
|
Fig. 5 Location of stars in the young (asterisks), intermediate (four-pointed stars), and old (three-pointed stars) age groups defined in the text in the surveyed area. The approximate boundaries of the associations are marked. |
| In the text | |
|
Fig. 6 Temperature-absolute magnitude diagram of stars in Cygnus OB2 selected by our criteria, assuming for the absolute magnitude a distance modulus DM = 10.8. Isochrones (dotted lines) and evolutionary tracks of stars of various masses (dashed lines) from Lejeune & Schaerer (2001) are plotted. Filled circles are stars of luminosities IV and V, open squares are giant stars of luminosity classes II and III, and open triangles and stars of luminosity class I. Typical uncertainties in both absolute magnitude and temperature as described in the text are represented in the lower right. |
| In the text | |
|
Fig. 7 Full normalized spectrum of BD + 40 4210 obtained with CAFOS, showing the broad emission features near 5600 Å and 5800 Å. |
| In the text | |
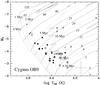 |
Fig. 8 Same as Fig. 6, now for the stars within the boundaries assigned to Cygnus OB9. |
| In the text | |
|
Fig. 9 Full normalized spectrum of J20223777+4140292 obtained with CAFOS, showing the emission features of NIII (4640 Å) and HeII (4686 Å). |
| In the text | |
|
Fig. 10 Same as Fig. 6, now for the stars outside the boundaries assigned to either Cygnus OB2 or Cygnus OB9. |
| In the text | |
|
Fig. 11 Images, color–color, and color–magnitude diagrams of the fields around the late O-type stars BD+42 3760, J20325571+4307583, and J20462826+4223417. The O stars are the brightest stars slightly left of the center of the images. North is at the top and east to the left in all the images, and the field of view measures approximately |
| In the text | |
|
Fig. 12 Histogram of derived ages of stars within the boundaries of Cygnus OB2 (solid line), Cygnus OB9 (dashed line), and in the field (dotted line). The histograms include all the O and B stars selected by our photometric criteria for which a spectroscopic classification is available, either from the literature or the present work. |
| In the text | |
Current usage metrics show cumulative count of Article Views (full-text article views including HTML views, PDF and ePub downloads, according to the available data) and Abstracts Views on Vision4Press platform.
Data correspond to usage on the plateform after 2015. The current usage metrics is available 48-96 hours after online publication and is updated daily on week days.
Initial download of the metrics may take a while.