Fig. 6
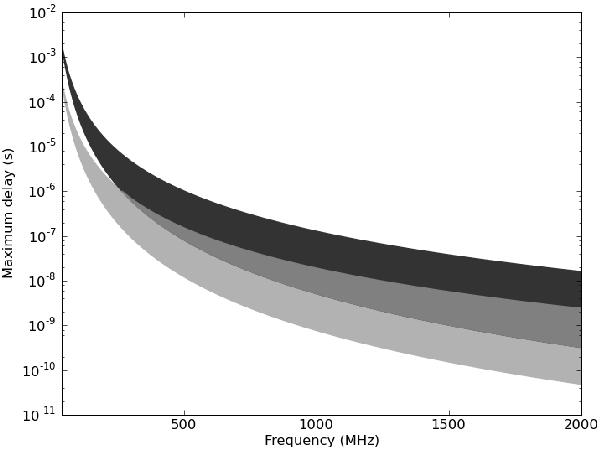
These curves show the upper limits on the size of delays from second-order ISM effects extrapolated up to higher frequencies. The dark grey area is for PSR B0809+74, which had the largest RMS residuals in our timing fits; the light grey area is for PSR B1919+21, which had the smallest RMS residuals. They are scaled with ν-3 and ν-4 which are the lower and upper bounds for scaling of the second-order ISM effects.
Current usage metrics show cumulative count of Article Views (full-text article views including HTML views, PDF and ePub downloads, according to the available data) and Abstracts Views on Vision4Press platform.
Data correspond to usage on the plateform after 2015. The current usage metrics is available 48-96 hours after online publication and is updated daily on week days.
Initial download of the metrics may take a while.