Fig. 5
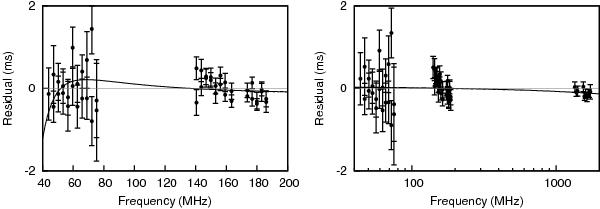
Simulations of structure in our residuals of PSR B1919+21. The top panel shows an example of our TOAs, with a simulated ν-4 ISM-like delay, which would be 0.84 ms at 48 MHz, added to them. The fit to the data is shown by the black line, and the null hypothesis (no ISM delay) is plotted in grey. Similarly, the right hand panel shows an example of a simulated aberration/retardation-like delay with a ν0.6 dependence which is 0.28 ms at 180 MHz. Because the errors on the TOAs are much smaller at high frequencies, we are much more sensitive to delays at high frequencies, despite the fitted jump. Note that the sensitivity of both the LOFAR LBA and HBA observations is now vastly improved and so we should be able to better constrain (or even detect) some of these effects in the near future.
Current usage metrics show cumulative count of Article Views (full-text article views including HTML views, PDF and ePub downloads, according to the available data) and Abstracts Views on Vision4Press platform.
Data correspond to usage on the plateform after 2015. The current usage metrics is available 48-96 hours after online publication and is updated daily on week days.
Initial download of the metrics may take a while.